
Articles
- Page Path
- HOME > STRESS > Volume 26(3); 2018 > Article
-
ORIGINAL ARTICLE
노인의 스트레스와 비만과의 관계에서 음식갈망의 매개효과 -
김주연

- The Mediating Effects of Food Craving on the Relationship between Stress and Obesity in Elderly
-
Ju Yeun Kim
-
Korean Journal of Stress Research 2018;26(3):215-222.
DOI: https://doi.org/10.17547/kjsr.2018.26.3.215
Published online: September 30, 2018
대원대학교 간호학과
Department of Nursing, Daewon University College, Jecheon, Korea
- Corresponding author Ju Yeun Kim Department of Nursing, Daewon University College, 316 Daehak Road, Jecheon 27135, Korea Tel: +82-43-649-3290 Fax: +82-43-649-3689 E-mail: kimjuri510@hanmail.net
• Received: August 15, 2018 • Revised: September 6, 2018 • Accepted: September 6, 2018
Copyright: © The Korean Journal of Stress Research
This is an open access article distributed under the terms of the Creative Commons Attribution Non-Commercial License (http://creativecommons.org/licenses/by-nc/4.0) which permits unrestricted non-commercial use, distribution, and reproduction in any medium, provided the original work is properly cited.
- 1,358 Views
- 28 Download
- 2 Crossref
Abstract
- 본 연구는 노인의 스트레스와 비만과의 관계에서 음식갈망의 역할을 확인하여, 궁극적으로는 노인의 적정 체중 관리를 위한 간호중재 개발 시 기초자료를 제공하고자 시도되었다. 연구결과 대상자들의 평균 체질량지수는 23.95±3.79 kg/m2이었으며, 25.8%가 비만이었다. 노인 비만의 관련 요인은 연령, 성별, 교육수준, 보유하고 있는 질환 수, 스트레스와 음식갈망으로 나타났으며, 스트레스와 음식갈망, 비만은 모두 양의 상관관계에 있었다. 노인의 스트레스와 비만과의 관계에서 음식갈망의 매개 효과를 검증한 결과 음식갈망의 매개 효과가 확인되었다. 그러므로 비만 노인의 체중 관리 위해서 음식갈망에 초점을 둔 치료적 개입이 필요하고, 노인의 음식갈망을 조절할 수 있는 간호 중재 개발이 필요하다.
Abstract
-
Background::
- The purpose of this study was to examine whether food craving mediated effects on the relationship between stress and obesity in the elderly population.
-
Methods::
- A descriptive correlational study was conducted. The participants included 256 elderly who had been attending three geriatric welfare facilities in J city. Data were collected between 9th and 20th, July 2018 with a structured questionnaire and body measurement. The measurements included G-FCQ-T, SRI-MF, and BMI. The statistical analysis included t-test, Pearson correlation analysis, Cronbach’s α, and mediation analysis with bootstrapping as recommended by Hayes’ PROCESS macro (2016).
-
Results::
- Mean BMI score was 23.95±3.79 kg/m2 and the prevalence of obesity was 25.8%. Significant difference were observed in the age (χ2=19.54, p<.001), gender (χ2=13.80, p<.001), education (χ2=7.43, p=.024), number of diseases (χ2=12.69, p=.002), medication (χ2=18.82, p< .001), stress (t=−2.57 p=.011), and food craving (t=−2.63 p=.003). Stress and food craving (r=.50, p<.001), food craving and obesity (r=.23, p<.001), and obesity and stress (r=.28 p<.001) were found to be positively correlated with each other. Food craving was found to mediate the relationship between stress and obesity in the elderly population (B=0.38 (SE=0.19), 95% CI, [0.05, 0.79]).
-
Conclusions::
- We need therapeutic intervention with a focus on food craving for weight management in obese elderly people and the development of a nursing intervention to control elderly food craving.
- 노인 비만은 심혈관계 질환 및 당뇨병, 퇴행성 관절염, 치매 등 많은 신체적 질환의 주요 원인으로 노인 건강문제와 고령자 진료비 증가의 중대한 원인이 될 뿐만 아니라(Han et al., 2011; Wang et al., 2018), 일상생활 기능 및 기동성의 장애로 인한 사회적 활동의 제한을 초래하여 삶의 질을 저하한다(Hyun HS et al., 2013; Wang et al., 2018). 그러므로 노인의 정상 체중 유지를 위한 다각적인 노력과 중재 마련이 중요하다고 할 수 있다. 노인 비만과 관련된 요인으로는 식습관, 신체활동 정도, 사회적 관계, 통증 등(Hyun HS et al., 2013; Wang et al., 2018)이 주요 원인으로 알려져 있으며, 스트레스와도 깊은 연관이 있는 것으로 보고되고 있다(Adam et al., 2007; Song YM et al., 2007; Torres et al., 2007; Chao et al., 2015). 스트레스와 체질량 지수(Body mass index, BMI)와의 상관관계를 확인한 연구들을 살펴보면 높은 수준의 스트레스는 체질량지수를 상승시킨다고 하였으며(Torres et al., 2007; Chao et al., 2015), 신체활동의 감소, 스트레스 관련 호르몬의 변화, 식습관의 변화, 수면시간 감소, 음식갈망 등이 인과요인으로 제시되었다(Adam TS., 2007; Chao et al., 2015).
- 특히 최근 연구들에서 음식갈망이 비만 중재를 위한 주요 변수로 밝혀지고 있는데(Chao et al., 2014; Chao et al., 2015; Kim JY, 2017a), 음식갈망이란 저항하기 어려운 특정 음식을 먹고자 하는 강렬한 욕구로 정의되며, 생리적이고 심리적인 방식으로 유발되고 표현될 수 있는 복합적으로 다차원적인 현상이다(Pelchat, 2002). 대다수 사람들은 일정 시점에 음식갈망을 경험하고 있으며, 모든 음식갈망이 병리적이지는 않지만 빈번한 음식갈망은 음식 섭취량을 증가시키고 체질량지수의 상승과 관련이 있다(Phlchat, 2002; Chao et al., 2015). 이를 뒷받침하는 생리적 이론에 의하면 음식갈망은 신체의 영양소와 에너지의 항상성을 유지하고 신경생물학적 물질을 공급하기 위한 음식 성분에 대한 정신 자극 효과로서, 식량부족이 음식갈망을 유발한다는 것이다(Phlchat, 2002). 음식갈망의 또 다른 이론은 스트레스와 같은 기분과 정서 상태에 의해 음식갈망이 유발된다는 심리적 이론으로서, 높은 수준의 불안이나 스트레스 등을 경험할 때, 부정적 정서를 낮추려는 노력으로 폭식을 하게 되고(Canetti et al., 2002; Macht, 2008), 건강한 음식보다는 인스턴트 음식이나 패스트푸드와 같은 정크푸드를 더 소비하는 경향이 있다고 하였다(Canetti et al., 2002). 또한 스트레스에 대처하는 생리적 기전으로 Hypothalamic–pituitary–adrenocortical (HPA) axis에서 스테로이드 호르몬인 Cortisol이 분비되어 먹는 갈망 행위를 조절한다는 것이다(Adam et al., 2007; Torres et al., 2007). 이 이론에 따르면 급성 스트레스 상황에서는 음식섭취가 일시적으로 감소할지라도 장기적인 스트레스 상황에 노출되면 Cortisol의 작용이 증가하여 식욕 증진이 유발된다고 하였으며, 많은 선행연구에서 만성 스트레스와 음식갈망과의 관계가 입증되었다(Adam et al., 2007; Torres et al., 2007; Chao et al., 2015).
- 그런데 노인의 경우 노화 과정과 더불어 신체적 변화와 경제적 불안정, 사회와 가정 내에서의 역할변화로 인하여 신체적, 정신적, 사회ㆍ문화적인 측면에서 만성적인 스트레스에 노출되어 있지만(Bae JE et al., 2013; Wang et al., 2018), 음식갈망은 감소하는 것으로 보고되고 있다(Pelchat, 1997; Potenza et al., 2014). 노인의 음식갈망이 감소하는 원인으로 인지장애와 운동장애, 치아 문제 등으로 인하여 식품선택과 섭취의 제한이 있고, 우울증이나 이환된 다른 질병들로 인해 배고픔을 느끼지 못하기 때문이라고 하였다(Pelchat, 1997; Pelchat et al., 2000; Gougeon et al., 2015). 또한 소금, 설탕 및 지방을 제한하는 특수식의 복용과 미각과 후각의 감소는 음식을 섭취하는 즐거움과 동기부여에 저해가 될 수 있다고 밝혀져 있다(Pelchat, 1997; Payette et al., 2005). 하지만 일부의 선행연구에서는 음식갈망이 신체의 영양소와 에너지의 항상성을 유지하기 위한 반응으로 유발된다면, 노인과 같이 경제적 요인이나 치아 문제 등으로 섭취가 제한된 경우 더욱 빈번하게 음식에 대한 갈망을 느끼게 될 것이라고 하였다(Nordstrom, 1982; Pelchat, 2002). 그리고 미각과 후각 기능의 감소는 음식으로 인한 자극이 감소하여 식욕과 체중이 감소하기도 하지만, 익숙한 수준의 음식 자극으로 만족할 수 없는 노인의 경우 더 높은 수준의 갈망을 경험하게 된다고 하였다(Pelchat, 1997). 이처럼 노인의 음식갈망은 적정 체중 관리를 위한 중요한 영양학적 고려사항임에도 불구하고, 일관되지 않은 논의가 지속되고 있다. 또한 음식갈망에 대한 국내연구도 양극성 장애 환자(Lee S et al., 2011), 당뇨 환자(Yu JH et al., 2013), 혈액투석 환자(Kim JY, 2017a) 등 일부 환자군에서만 확인되고 있으며, 스트레스와 비만과의 관계를 확인하는 연구도 대부분 일반성인이나 여성을 대상으로 이루어지고 있다(Song YM, 2007; Kim JS et al., 2011). 그러므로 본 연구는 만성 스트레스에 빈번히 노출되어 있는 노인을 대상으로 스트레스와 비만과의 관계에서 음식갈망의 잠재적 역할을 확인하여 노인의 적정 체중 관리를 위한 간호중재 개발 시 기초자료를 제공하고자 한다.
서 론
- 1. 연구 설계
- 본 연구는 노인의 스트레스와 비만과의 관계를 파악하고, 음식갈망의 영향을 확인하기 위한 서술적 관계 조사연구이다.
- 2. 연구 대상
- 본 연구는 J 시에 소재한 3개의 노인복지관을 이용하는 재가 노인 중 치매나 정신과 질환 등으로 치료한 과거력이 있거나 현재 치료 중인 자, 뇌졸중, 심근경색, 간경화 또는 암 등의 중대한 내과 질환이 있는 자를 제외한 65세 이상 남녀노인을 대상으로 하였다. 개인정보 수집과 연구 참여에 동의한 자는 총 268명이었으나, 이 중 체질량지수 18.5 kg/m2 미만(n=13)을 제외하고 256명을 최종 분석대상으로 선정하였다.
- 3. 연구 도구
- 체질량 지수(Body Mass Index, BMI)는 신체 계측에 의한 체중과 신장을 측정한 결과를 이용하여 체중(kg)/신장(m2)으로 산출한다. WHO 아시아ㆍ태평양 지역 비만 기준(WHO, 2000)에 따라 18.5 이상 25 미만을 정상 체중군으로, 25 이상을 비만군으로 분류하였다.
- 스트레스 정도를 측정하기 위해 Choi SM et al. (2006)이 Koh KB et al. (2000)의 도구를 보완하여 신뢰도와 타당도를 검증한 스트레스 반응 척도 수정판(Stress Response Inventory-Modified Form, SRI-MF)을 개발자에게 도구 사용의 승낙을 받은 후 사용하였다. SRI-MF는 한국인의 언어와 심리적 특징이 잘 반영되어 있고 주요한 스트레스 주요 반응을 인지, 정서, 행동, 신체적 반응의 틀에서 다각도로 측정한 장점이 있다. 또한 기존 척도의 대표성 및 설명력을 갖는 문장들을 선정하여 단축형으로 제작하였고, 적절한 신뢰도와 타당도를 보여주어 임상 장면에서 활용도를 높인 도구이다. 문항구성은 감정, 인지, 신체, 행동 4가지 스트레스 반응영역에 해당하는 내용의 22개 문항으로, ‘신체화’, ‘우울’, ‘분노’의 3개 요인으로 구성되어 있으며 0점∼4점까지 5점 척도로 응답할 수 있다. 총점은 0점∼88점의 범위를 지니며, 점수가 높을수록 스트레스 반응수준이 높은 것을 의미한다. 개발 당시 Cronbach’s α=.93 이었으며(Koh KB et al., 2000), 본 연구에서의 Cronbachs’ α=.93이었다.
- 음식 갈망 정도를 측정하기 위해 일반적 음식갈망-특질 척도(General-Food Craving Questionnaire-Trait, G-FCQ-T) (Nijs et al., 2007)를 Noh JH et al. (2008)이 한국어로 번역 타당화한 도구를 저자에게 도구사용의 승낙을 구한 후 사용하였다. G-FCQ-T는 한 개인이 시간이나 환경에 무관하게 경험하는 섭식 욕구를 평가하는 도구로서 1점부터 6점까지 평가하는 21개의 문항으로 구성되어 있다. 4개의 하위요인은 음식이나 식사에 대한 강박적 몰두를 평가하는 ‘음식에 대한 몰두(preoccupation with food)’ 6문항, 음식 단서에 노출되었을 때 먹는 행동을 멈추기 어려운 경향인 ‘통제 상실(loss of control)’ 6문항, 음식을 먹는 것이 긍정적 혹은 부정적 강화를 줄 것이라는 기대의 정도를 평가하는 ‘긍정적 결과 기대(positive outcome expectancy)’ 5문항, 그리고 부정적 정서를 경험했을 때 음식이 당기는 ‘정서적 갈망(emotional craving)’ 4문항으로 구성되어 있다. Noh JH et al. (2008)의 연구에서 Cronbach’s α=.875이었으며, 본 연구에서의 Cronbach’s α=.92이었다.
- 4. 자료 수집
- 본 연구의 자료수집은 2018년 7월 9일부터 7월 20일까지 설문지조사와 신체 계측을 통하여 이루어졌다. 연구 대상자의 모집을 위하여 J 시에 위치한 노인복지관 3개소의 기관장에게 연구계획서를 제공하고, 연구에 대한 목적과 방법 및 자료수집방법 등에 관해 설명한 후 연구 진행에 대한 승낙을 구하였다. 연구 진행이 허락된 후 연구참여자 모집공고 후 자발적으로 연구 참여에 동의한 자를 대상으로 하였다. 자료수집을 위한 설문조사 및 신체 계측은 연구자에게 사전교육을 받은 연구보조원 2명에 의해 시행되었다. 설문조사는 대상자와 직접 면접을 통하여 이루어졌으며, 전자저울과 신장 계측기를 이용하여 키와 체중을 측정하였다.
- 5. 자료 분석
- 수집된 자료는 IBM/SPSS/WIN 22.0 program을 이용하여 분석하였다. 대상자의 일반적 특성과 비만, 스트레스, 음식갈망의 정도는 실수와 백분율, 평균과 표준편차로 분석하였고, 노인 비만군과 정상체중군의 인구 사회학적 특성 및 스트레스와 음식갈망, 비만 정도의 차이는 independent t-test, χ2-test, Fisher’ exact test로 분석하였다. 측정 도구의 신뢰도를 확인하기 위한 내적 일관성은 Cronbach’s alpha 계수를 이용하였으며, 노인의 스트레스와 비만과의 관계에서 음식갈망의 매개효과를 검증하기 위하여 Hayes(2016)의 PROCESS macro의 model 4를 적용하여 분석하였다. 간접효과의 유의성 검증을 위해서 비모수 재표본(non-parametric resampling) 방법으로 알려진 부트스트랩핑(bootstrapping) 기법을 이용하였는데, 부트스트랩의 표본수는 5,000개였으며, 신뢰구간은 95% 편의교정 신뢰구간(bias-corrected confidence interval)을 이용하였다. 부트스트래핑을 통해서 5,000개의 표본을 추출한다면 모든 표본의 평균을 통해 ab의 크기가 추정되고, 5,000개의 ab 추정치의 표준편차를 계산하여 표준오차를 추정하게 된다. 매개효과의 유의도는 ab 표집분포에서 95% 신뢰구간 내에 0이 포함되어 있는지 아닌지로 판단한다. 만일 신뢰구간 내에 0이 포함되어 있지 않으면 p=.05수준에서 매개효과가 0가 다르다고 볼 수 있기 때문에 유의한 것으로 판정한다(Lee HE, 2014).
- 6. 윤리적 고려
- 자료수집 진행에 앞서 D대학의 기관 생명윤리위원회로부터 연구에 대한 승인을 받았다(승인번호: DUC-2018-06-001-01). 대상자에게 연구목적 및 방법, 연구 참여에 대한 익명성 보장, 자발적인 연구 참여 동의와 거부, 중도 포기 기능 및 발생 가능한 이익과 불이익, 개인정보 제공에 대한 동의를 포함한 내용을 구두와 서면으로 설명하였다. 연구의 설문 조사 후 수집된 정보는 통계자료 처리 시 부호화하여 입력하였으며, 수집 자료는 연구자 연구실의 잠금장치가 있는 곳에 보관하였다. 연구논문이 인쇄자료로 발표된 후에는 모두 분쇄폐기 처분하였다.
연구방법
1) 체질량 지수(Body mass index, BMI)
2) 스트레스
3) 음식갈망
- 1. 비만군과 정상체중군의 일반적 특성의 차이
- 비만군과 정상체중군의 일반적 특성의 차이는 동거상태, 흡연 여부, 음주 상태와 운동 회수 및 시간은 통계적으로 유의한 차이를 보이지 않았다. 그러나 연령(χ2=19.54, p<.001), 성별(χ2=13.80, p<.001), 교육 정도(χ2=7.43, p=.024), 만성질환 이환 개수(χ2=12.69, p=.002)와 복용 약물의 수(χ2=18.82, p<.001)에 따라 통계적으로 유의한 차이가 있었다(Table 1).
- General characteristics of the subjects in normal weight and obese group (N=256)
- 2. 비만, 스트레스, 음식갈망의 결과
- 전체 대상자의 평균 체질량지수는 23.95±3.79 kg/m2이며, 25.8% (66명)가 비만에 이환되어 있었다. 대상자의 스트레스 점수는 17.70±18.53점이었으며, 하위 변수별로는 신체화 7.50±8.06점, 우울 6.36±8.10점, 분노 3.84±4.30점으로 나타났다. 음식갈망은 46.71±21.87점이었고, 하위변수별로는 음식에 대한 몰두 11.82±7.02점, 통제 상실 12.94±7.05점, 긍정적 결과 기대 14.60±6.70점, 정서적 갈망 7.25±5.21점으로 나타났다(Table 2).
- Descriptive statistics of study variables (N=256)
- 3. 비만군과 정상체중군의 스트레스와 음식갈망의 차이
- 대상자의 스트레스 정도는 정상체중군에서 0.73±0.81, 비만군에서 1.03±0.91로 비만군의 스트레스 정도가 더 높았으며, 이는 통계적으로 유의한 차이를 보였다(t=−2.57, p=.011). 대상자의 음식갈망 역시 정상체중군에서 2.11±0.96, 비만군에서 2.54±1.19로 비만군에서 음식갈망의 정도가 높고, 통계적으로 유의한 차이를 보였다(t=−2.63, p=.003) (Table 3).
- Descriptive statistics of study variables in normal weight and obese group (N=256)
- 4. 비만, 스트레스, 음식갈망의 상관관계
- 대상자의 비만과 스트레스, 음식갈망의 상관관계 결과 체질량지수와 스트레스(r=.28, p<.001), 스트레스와 음식갈망(r=.50, p<.001), 음식갈망과 체질량지수(r=.23, p<.001)는 모두 통계적으로 유의한 양의 상관관계를 보였다(Table 4).
- Correlations among study variables (N=256)
- 5. 스트레스와 비만과의 관계에서 음식갈망의 매개효과
- Hayes(2016)의 PROCESS macro의 model 4를 적용하여 스트레스(독립변수)와 체질량지수(종속변수)와의 관계에서 음식갈망의 매개 효과를 분석하였다. Fig. 1과 Table 5는 음식갈망(매개변수)과 비만에 대한 비표준화 계수와 표준편차, 신뢰구간을 나타낸다. 먼저 스트레스는 음식갈망(Path a) (B=0.60, SE=0.07, t=8.69, p<.001)과 체질량지수(Path c) (B=0.60, SE=0.28, t=2.19, p=.030)에 모두 통계적으로 유의하게 나타났으나, 스트레스와 음식갈망을 동시에 회귀모델에 투입하였을 때는 음식갈망은 체질량지수(Path b)에 유의하였고(B=0.63, SE=0.25 t=2.55, p=.012), 스트레스는 체질량지수(Path c’)에 더이상 유의하지 않았다(B=0.23, SE=0.31 t=0.73, p=.467). 간접효과의 크기가 통계적으로 유의한지 확인하기 위하여 부트스트래핑을 적용한 결과 스트레스가 음식갈망을 거쳐 체질량지수로 가는 경로는 95% 편의교정 신뢰구간에서 0을 포함하지 않음으로 스트레스와 체질량지수의 관계에서 음식갈망의 매개 효과(B=0.38 (SE=0.19), 95% CI, [0.05, 0.79])가 확인되었다.
- Mediating effect of food craving on the relationship between stress and BMI
결 과
Table 1
Table 2
Table 3
Table 4
| Food Craving | BMI | |
|---|---|---|
|
|
||
| r (p) | r (p) | |
| Stress | .50 (<.001) | .28 (<.001) |
| Food Craving | .23 (<.001) | |
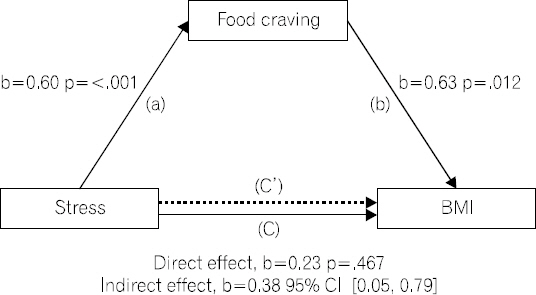
Table 5
- 본 연구는 노인 비만에 영향을 미치는 다양한 요인을 확인하고, 노인의 스트레스와 비만과의 관계에서 음식갈망의 역할을 규명하여 궁극적으로는 노인의 적정 체중 관리를 위한 간호 중재 개발 시 기초자료를 제공하고자 시도되었다. 본 연구에서 대상자들은 시에 거주하는 노인으로 평균 체질량지수는 23.95±3.79 kg/m2이었고, 비만 유병률은 25.8%로 조사 되었다. 이는 전국 조사로 이루어진 국민영양조사(2018)에서 65세 이상 노인의 비만 유병률 34.4%와 노인실태조사(2017)의 비만 유병률 29.5%보다 낮은 결과로서, 거주지역에 의한 차이로 생각된다. 2016년 국민영양조사에서도 읍면지역에 거주하는 경우 동에 거주할 경우보다 비만 유병률이 높았으며, 선행연구들에서도 농촌노인의 비만 유병률이 급증하고 있음을 보고하고 있다(Yeom et al., 2009; Kim MY et al., 2012). 그러므로 거주지역에 따른 건강관련 변인의 편차가 노년기의 특징임을 인지하고(Yeom JH, 2014), 지역사회 특성을 고려한 비만관련 요인의 현황 파악이 필요하다.
- 정상체중군과 비만군 간의 인구 사회학적 특성의 차이를 확인한 결과, 65∼74세 군이 75세 이상 군보다 비만의 비율이 높았으며, 이와 같은 결과는 노인의 연령이 증가할수록 비만의 비율이 낮아진 선행연구들의 결과(Kim JS et al., 2011; Kim MY et al., 2012; Kim JY, 2017b)와 일치한다. 이는 노화로 인한 신장의 저하와 체성분의 변화(Han et al., 2011) 등으로 설명되고 있으나 이로 인하여 노인에서의 체질량지수는 체지방 정도를 상대적으로 낮게 평가할 수 있다. 그러므로 체질량지수의 연령대별 기준 정립이 필요하고, 노인의 비만 평가를 위한 비만 지표의 개발과 기준 확립을 위한 연구가 지속해서 이루어져야 할 것이다.
- 정상체중군과 비만군 간의 일반적 특성의 차이를 보였던 또 다른 변수는 성별이었다. 성별은 비만의 강력한 예측변수로서, 특히 노년기 여성은 폐경기 이후 에스트로젠 감소에 따른 체지방 분포 변화로 복부비만 및 내장지방의 증가가 가속화된다(Han et al., 2011; Hallam et al., 2016)고 하였다. 그러나 Johansson et al. (2014)는 높은 체질량지수가 폐경 후 여성에서 에스트로젠 감소로 인한 뼈 손실 속도를 늦추는 데 효과가 있어, 골다공증이나 둔부 골절을 낮추는 것으로 보고하였고, Song et al. (2007)의 연구에서는 폐경기 이후 여성의 사망률이 오히려 저체중군에서 의미 있는 결과로 보고되기도 하였다. 그러므로 여성 노인의 체질량지수에 따른 장기적인 건강 결과에 대한 반복연구가 필요하며, 간호 중재 적용 시 각별한 관심과 대처가 요구된다.
- 노인의 교육수준은 비만에 영향을 미치는 중요한 변수로 밝혀져 있고(Yeom et al., 2009; Kim MY, 2012), 본 연구에서도 교육수준이 낮을수록 비만의 비율이 높았다. 이는 교육수준이 건강 관련 지식이나 건강 행위를 선택하는 생활 태도 등과 밀접한 관련이 있기 때문이라고 볼 수 있다. 또한 비만은 질환의 유병과도 관련이 있었는데, 비만 노인의 경우 보유하고 있는 질환 수와 복용 약물이 2개 이상인 비율이 높았으며, 이는 비만이 심혈관계 질환 및 당뇨병, 퇴행성 관절염이나 치매 등 많은 신체적 질환의 원인이 된다는 선행연구들의 결과(Paytte et al., 2005; Han et al., 2011)를 뒷받침하는 결과라 하겠다.
- 대상자의 스트레스와 음식갈망의 정도를 확인한 결과 스트레스 점수는 17.70±18.53점으로 나타났다. 이와 같은 결과는 같은 도구를 이용하여 노인의 스트레스를 측정한 결과가 없어 직접 비교는 어려우나, 근로자를 대상으로 조사한 Choi SM et al. (2006)의 25.70±15.80점보다는 낮았다. 하지만 노인의 스트레스는 일반 성인의 스트레스와 달리 노화와 더불어 신체적 건강의 약화, 배우자 죽음, 수입 감소, 직업과 지위의 상실, 노화로 인한 상실감과 고립감 등 심리, 사회, 경제적인 영역 모두에서 스트레스를 받게 되고, 이러한 스트레스 상황에 최소 몇 개월에서 수년에 이르는 기간에 노출되어 있다(Bae SE et al. 2011). 하지만 스트레스를 측정하는 대부분의 도구는 지난 1개월 혹은 1주일의 경험이나 생활 사건을 측정하도록 개발되어 있고(Koh KB et al., 2000; Choi SM et al., 2006), 본 연구에서도 지난 1주일 동안의 스트레스 반응을 확인하였으므로 만성적인 스트레스에 노출된 노인의 스트레스 정도를 정확히 사정하기에 어려움이 있었다고 생각된다. 그러므로 노인이나 치매 환자를 돌보는 보호자 등 만성적인 스트레스 상황에 노출된 대상자들의 스트레스 수준을 포괄적으로 확인할 수 있는 도구 개발이 필요하다. 또한 급성 스트레스와 만성 스트레스가 체질량지수와 신체에 미치는 결과가 다르므로(Adam et al., 2007; Torres et al., 2007), 급성과 만성 스트레스를 구분하여 비만과의 관계를 확인하는 추후 연구가 이루어져야 할 것이다.
- 본 연구에서 대상자의 음식갈망은 46.71±21.87점으로 나타났다. 이와 같은 결과는 혈액투석 환자 53.00점(Kim JY, 2017a), 양극성 장애 환자 53.51점(Lee et al., 2011), 대학생 52.28점(Noh JH et al., 2008)보다는 낮았지만, Lee S et al. (2011)의 연구에서 대조군으로 설정된 일반성인(평균연령 36.73세)의 47.17점과는 유사한 결과이다. 즉, 노인의 음식갈망은 엄격한 식이 제한이나 약물의 영향을 받는 환자군이나 청년보다는 낮을 수 있으나 일반성인과는 큰 차이가 없다는 것을 보여준다. 그동안 노인의 비만은 생존편향이나 사망률, 아픈 노인이 의도하지 않은 체중감소 등을 이유로 과대평가 되었다는 논의가 있었으나(Han TS., 2011), 본 연구의 결과는 노인의 음식갈망은 줄어들지 않으면서 기초대사율과 호르몬의 변화 등으로 인하여 비만이 더욱 가중될 수 있다는 것을 의미하고 노인의 체중 관리의 중요성을 지지하는 결과라 하겠다. 또한 Yu JH et al. (2013)의 연구에서 당뇨병 환자군은 고지방 음식보다는 고탄수화물 음식에 대한 욕구가 강했다고 보고하였고, Pelchat(1997)의 연구에서는 젊은 여성이 노인 여성보다 초콜릿과 과자 등 당류에 갈망이 높은 것으로 나타났다. 그러므로 노인의 음식갈망 수준이 성인과 비슷하다면 음식갈망이 높아지는 식품도 일치하는지 다양한 식품군을 포함하여 이를 확인하는 추가연구가 필요하다.
- 반면 Pelchat(2002)는 노인의 음식갈망이 유발되도록 자극하지 않는다면 심각한 영양 문제가 초래될 수 있다고 하였으며, 그 이유 중 하나로 알코올 남용 등 음식이 아닌 다른 것으로 갈망이 대체되기 때문이라고 하였다. 또한 Chao et al. (2014)의 연구에서도 음식갈망과 체질량지수가 음식섭취량에 미치는 상호작용 효과는 없는 것으로 나타났다고 하면서, 이는 음식갈망이 높다 하더라도 섭취하는 총 열량이 다르거나 운동이나 신체활동 등이 영향을 미쳤을 수 있으며, 비만한 사람이 실제 섭취량보다 적게 보고했을 수 있다고 해석하였다. 그러므로 노인 인구에서는 음식갈망이 높다 하더라도 경제적, 물리적 이유로 섭취량이 감소하거나 다른 쪽으로 갈망이 대체될 수 있으며, 본 연구에서도 65∼74세군보다 상대적으로 빈곤하거나, 치아 상태가 불량할 것으로 예상되는 75세 이상 고령 노인의 체질량지수가 더 낮게 나타났다. 그러므로 추후 고령 인구에서 음식갈망과 음식 섭취량, 체질량지수와의 관계를 확인하고 그 결과가 노인의 심리, 신체적으로 어떠한 결과를 초래하는지 심도 있는 연구를 시도해 볼 필요가 있겠다.
- 정상체중군과 비만군 간의 스트레스와 음식갈망의 차이를 살펴본 결과 비만군의 스트레스와 음식갈망의 점수가 정상체중군보다 통계적으로 유의하게 높았으며, 스트레스, 음식갈망, 비만 모두 유의한 양의 상관관계에 있었다. 즉, 스트레스와 음식갈망 모두 노인 비만과 관련이 높은 심리적 변수임을 확인할 수 있었으며, 스트레스와 비만(Song YM, 2007; Torres et al. 2007; Kim JS et al., 2011; Chao et al, 2014), 음식갈망과 비만 (Pelchat, 2002; Chao et al., 2015; Hallam J et al., 2016)과의 관련성을 밝힌 많은 선행연구와 일치하는 결과이다. 본 연구에서는 이 변수간의 관계와 경로를 통합적으로 확인하기 위하여 스트레스와 비만과의 관계에서 음식갈망의 매개효과를 검증하였으며, 그 결과 음식갈망은 스트레스와 비만과의 관계를 매개하는 것으로 나타났다. 이와 같은 결과는 만성적인 스트레스에 노출된 노인은 높은 수준의 음식갈망을 경험하게 되어 비만이 될 확률이 높아짐을 의미하고, 만성 스트레스로 인한 Cortisol의 증가는 내장지방의 축적 외에 뇌의 보상 기전으로 식욕을 향상시켜 체중증가를 일으킨다는 Reward Based Stress Eating Model(Adam et al., 2007)을 뒷받침한다. 그러므로 스트레스 관리와 음식갈망 조절은 비만 노인의 체중조절을 위해 고려해야 할 중요한 변수이며, 특히 음식갈망에 초점을 둔 치료적 개입이 필요하다.
- 음식갈망 중에서도 정상체중군과 비만군은 음식 단서에 노출되었을 때 먹는 행동을 멈추기 어려운 경향인 ‘통제 상실’에서 통계적으로 유의한 차이가 있었다. ‘통제 상실’은 고열량 음식을 선호할 경우 높아지는 변수로 밝혀져 있으며(Pelchat, 2002), 음식에 대한 통제가 상실되는 가장 주요한 요인으로는 이미 많은 선행연구에서 스트레스와 부정적 정서라고 보고되어 왔다(Canetti et al., 2002; Torres et al., 2007). 그러므로 노인의 스트레스와 우울, 고립감, 권태감 등 음식갈망을 유발하는 부정적 정서에 대한 관리는 결국 노인의 신체적, 정신적 영역을 모두 충족시키는 중재방안이 될 것이다. 하지만 노인 인구에서의 건강관리의 초점은 만성질환 관리와 신체적 기능상태에 집중되어 급식이나 신체 수발, 일상생활에 필요한 편의 제공 등에 더 큰 관심이 계속되고 있으며, 비만 예방을 위한 건강증진 프로그램 역시 금연이나, 운동, 적당한 알코올과 과일 섭취 등 보호적 생활 습관 채택 등에 대해서만 강조되고 있다(Kim JY, 2017b). 그러므로 노인의 적정 체중 관리를 위해서는 생활습관의 변화와 더불어 부정적 정서를 조절할 수 있는 중재 프로그램을 적용하고 그 효과를 확인하는 연구가 이루어져야 할 것이다.
- 정상체중군과 비만군과 사이에서 차이를 보인 음식갈망의 또 다른 하위변수는 ‘긍정적 결과 기대’ 였다. 음식의 색깔이나 형태와 같은 시각적 단서들은 학습되거나 혹은 내재된 상태로 특정 맛에 대한 기대수준을 조정하여 맛 지각 과정에 관여하는데, 비만 집단의 경우는 시각적 단서에 대한 과도한 주의와 민감성, 주의편향이 높아진다고 하였다(Hur JW, 2017). 그런데 현대인들은 수많은 음식 광고와 고열량이면서 영양가가 낮은 식품에 쉽게 노출되어 있으며, 외국에서는 이와 같은 환경을 ‘toxic food environment’라고 명명하고 담배광고를 제한하듯이 TV에서 에너지 고밀도의 제품에 대한 광고를 제한하도록 하는 정책이 논의되고 있다(Boswell et al., 2016). 비만이 노인 인구에서뿐 아니라 전 연령대에서 건강악화와 진료비 증가의 중대한 원인임을 고려한다면 국내에서도 이와 같은 정책을 고려해 볼 필요가 있겠다. 이 외에도 음식갈망의 조절을 위한 중재 방법으로 인지행동치료(Cognitive Behavioraltherapy, CBT) (Hay, 2013), 심상 치료(Mindfulness-Based Therapies, MBTs) (Katterman et al., 2014) 등의 효과가 입증되고 있으나 대부분 섭식장애 또는 신경성 폭식증 환자를 대상으로 효과를 확인한 요법이다. 음식갈망과 폭식증은 유사한 특성을 공유하지만, 나타나는 현상과 요인의 차이가 존재하므로(Potenza et al., 2014) 음식갈망을 경험하는 일반 성인이나 노인에게 이와 같은 중재방법을 적용하기에는 무리가 있다. 그러므로 노인의 음식갈망을 좀 더 심도 있게 확인하는 추후 연구가 이루어져야 할 것이며, 이를 근거로 다양한 중재 프로그램 개발 및 국가적 정책 마련이 요구된다.
- 본 연구의 제한점은 다음과 같다. 첫째, 본 연구는 대상자의 표집을 일부 특정지역에 거주하는 노인으로 편의 표집 하였으므로, 연구결과를 한국 노인 전체로 일반화하기에는 한계가 있을 수 있다. 따라서 노인의 스트레스와 비만, 음식갈망의 관계에 대한 일반화를 증진하기 위하여 무작위 반복연구가 필요하다. 둘째, 음식갈망이 음식에 대한 다차원적인 심리적 욕구임에도 불구하고 본 연구는 횡단적 설계로 이루어져 각 변수간의 인과관계를 유추할 수 없다. 이러한 관계의 방향성에 대한 더 많은 통찰력을 제공하기 위해서는 종단연구가 필요하다. 셋째, 스트레스와 비만과의 관계에 기여할 수 있는 먹는 행동과 신체 활동, 교감신경계 활성화 및 HPA축의 기능변화 등을 포함한 잠재적 기전(Torres et al., 2007)들이 고려되지 않았다. 그러므로 만성 스트레스와 음식갈망, 비만과 관련된 생리적 기전과 행동 변화에 대한 탐색연구가 추가로 이루어져야 할 것이다. 이러한 제한점에도 불구하고 본 연구는 비만의 주요 원인으로 밝혀진 스트레스가 음식갈망을 거쳐서 비만에 영향을 미칠 수 있다는 것을 확인하였으며, 노인의 스트레스와 음식갈망, 비만과의 관계를 설명하는 기제에 대한 이해를 높였다는데 그 의의가 있다.
고 찰
- Adam TC, Epel ES. 2007;Stress, eating and the reward system. Physiol &Behav. 91(4):449-458. doi:10.1016/j.physbeh.2007.04.011.Article
- Bae JE, Kim HH, Yang MG, et al. 2013;Stress and management strategies in Korean elderly. Crisisonomy. 9(3):175-194. http://uci.or.kr/G704-SER000001473.2013.9.3.006
- Canetti L, Bachar E, Berry EM. 2002;Food and emotion. Behav Processes. 60(2):157-164. doi:10.1016/s0376-6357(02)00082-7.ArticlePubMed
- Chao A, Grilo CM, White MA, et al. 2014;Food Craving, Food intake, and weight status in a community based sample. Eat Behav. 15(3):478-472. doi:10.1016/j.eatbeh.2014.06.003.PubMedPMC
- Chao A, Grilo CM, White MA, et al. 2015;Food craving mediate the relationship between chronic stress and body mass index. J Health Psychol. 20(6):721-729. doi:10.1177/1359105315573448.ArticlePubMedPMC
- Choi SM, Kang TY, Woo JM. 2006;Development and validation of modified form of the stress response inventory for workers. J Korean Neuropsychiatric Assoc. 45(6):541-553. http://uci.or.kr/G704-001050.2006.45.6.006
- Gougeon L, Payette H, Morais J, et al. 2015;Dietary patterns and incidence of depression in a cohort of community-dwelling older canadians. J Nutr Health Aging. 9(4):431-436. doi:10.1007/s12603-014-0562-9.Article
- Han TS, Tajar A, Lean MEJ. 2011;Obesity and weight management in the elderly. Br Med Bull. 97:169-196. doi:10.1093/bmb/ldr002.ArticlePubMed
- Hallam J, Boswell RG, Devito EE, et al. 2016;Gender-related difference in food craving and obesity. Yale J Biol Med. 89(2):161-173. PMID:27354843.PubMedPMC
- Hay PA. 2013;A systematic review of evidence for psychological treatments in eating disorders 2005-2012. Int J Eat Disord. 46(5):462-469. doi:10.1002/eat.22103.ArticlePubMed
- Hayes AF. In EH Lee, YH Jung, LY Song, JS Kim, KY Hwang (Eds.),2016, Discovering statistics using. 4th edition. Gyeonggi-do: Koonja. (Original work published 2012).
- Hur JW. 2017;Psychological mechanism and clinical implications of taste perception: A literature review. Kor J Psychol: Gen. 36(2):189-213. doi:10.22257/kjp.2017.06.36.2.189.Article
- Hyun HS, Lee IS. 2013;Body Mass Index related factors of community dwelling elders: comparison between early and late elderly people. J Korean Acad of community health nurs. 24(1):62-73. doi:10.12799/jkachn.2013.24.1.62.Article
- Johansson H, Kanis JA, Odén A, et al. 2014;A meta-analysis of the association of fracture risk and body mass index in women. J Bone and Miner Res. 29(1):223-233. doi:10.1002/jbmr.2017.Article
- Katterman SN, Kleinman BM, Hood MM, et al. 2014;Mindfulness meditation as an intervention for being eating, emotional eating and weight loss: A systematic review. Eating Behav. 15(2):197-204. doi:10.1016/j.eatbeh.2014.01.005.Article
- Kim JY. 2017a;Factors Affecting Food Craving among Hemodialysis Patients. J Korean Clini Nur Res. 23(3):398-406. doi:10.22650/JKCNR.2017.23.3.398.
- Kim JY. 2017b;The relationship between negative emotion and obesity of the elderly. JKAIS. 18(12):254-263. doi:10.5762/KAIS.2017.18.12.254.
- Kim MY, Oh JK, Lim MK, et al. 2012;The association of Socioeconomic and Psychosocial Factors with Obesity in a Rural Community. Journal of Obesity & Metabolic Syndrome. 21(1):18-25. doi:0.7570/kjo.2012.21.1.18Article
- Kim JS, Kim YH, Yu JO. 2011;Factors Contributing to Low Weight in Community Dwelling Older Adults. J Koran Acad Community Health Nurs. 22(4):429-437. doi:10.12799/jkachn.2011.22.4.429.Article
- Koh KB, Park JK, Kim CH. 2000;Development of the stress response inventory. J Korean Neuropsychiatric Assoc. 39(4):707-719. doi:10.1097/00006842-200107000-00020.
- Korea Centers for Disease Control and Prevention. 2018 2016 Korea National Health and Nutrition Examination Survey [Internet] Retrieved from https://knhanes.cdc.go.kr/knhanes/sub04/sub04_03.do?classType=7
- Korea Institute for Health and Social Affairs. 2017 2017 National Survey of Welfare Need in the elderly. [Internet] Retrieved from http://www.mohw.go.kr/react/jb/sjb030301vw.jsp?PAR_MENU_ID=03&MENU_ID=032901&CONT_SEQ=344953&page=1
- Lee S, Ryu SH, Ko HJ, et al. 2011;Changes of appetite and eating behavior in bipolar disorder patients:Measurement with General-Food Craving Questionnaire-Trait and the Drug-Related Eating Behavior Questionnaire. Korean J Biol Psychiatry. 18:245-253. http://uci.or.kr/G704-001487.2011.18.4.009
- Lee HE. 2014;Review of method for testing mediating effects in recent HRD research. The Korean Journal of Human Recource Development Quarterly. 16(2):225-249. doi:10.18211/kjhrdq.2014.16.3.009.
- Macht M. 2008;How emotions affect eating: a five way model. Appetite. 50(1):1-11. doi:10.1016/j.appet.2007.07.002.ArticlePubMed
- Nijs IM, Franken IH, Muris P. 2007;The modified trait and state food-cravings questionnaires: development and validation of a general index of food craving. Appetite. 49(1):38-46. doi:10.1016/j.appet.2006.11.001.ArticlePubMed
- Nordstrom JW. 1982;Trace mineral nutrition in the elderly. Am Journal of Clin Nutr. 36(4):788-795. doi:10.1093/ajcn/36.4.788.Article
- Noh JH, Kim JH, Nam HJ, et al. 2008;Validation of the Korean version of the general food craving questionnaire-trait (G-FCQ-T). Kor J Clin Psychol. 27(4):1039-1045. doi:10.15842/kjcp.2008.27.4.015.
- Payette H, Shatenstein B. 2005;Determinants of healthy eating in community-dwelling elderly people. Can J Public Health. 96(3):S27-S31. PMID:16042161.PubMed
- Pelchat ML. 1997;Food craving in young and elderly adults. Appetite. 28(2):103-113. doi:10.1006/appe.1996.0063.ArticlePubMed
- Pelchat ML. 2002;Of human bondage: food craving, obsession, compulsion, and addiction. Physiol &Behav. 76(3):347-352. doi:10.1016/S0031-9384(02)00757-6.
- Potenza MN, Grilo CM. 2014;How relevant is food craving to obesity and its treatment? Frontier in Psychiatry. 164(5):1-5. doi:10.3389/fpsyt.2014.00164.Article
- Song YM, Ha M, Sung J. 2007;Body mass index and mortality in middle-Aged Korean women. Ann Epidemiol. 17(7):556-563. doi:10.1016/j.annepidem.2007.01.028.ArticlePubMed
- Torres SJ, Nowson CA. 2007;Relationship between stress, eating behavior, and obesity. Nutrition. 23(11-12):887-894. doi:10.1016/j.nut.2007.08.008.ArticlePubMed
- Wang L, Crawford JD, Reppermund S, et al. 2018;Body mass index and waist circumference predict health-related quality of life, but not satisfaction with life in the Elderly. Quali Life Res. 1-13. doi:10.1007/s11136-018-1904-6.Article
- World Health Organization. 2000 Obesity: preventing and managing the global epidemic. Report of a WHO consultation. World Health Organ Technical Report Series 894:1-253. [Internet]. Retrieved from http://apps.who.int/iris/handle/10665/42330
- Yeom J, Kim JK, Crimmins EM. 2009;Factors Associated with Body Mass Index (BMI) Among Older Adults: A Comparison Study of the U.S., Japan, and Korea. Journal of Gerontological Society. 29(4):1479-1500. http://uci.or.kr/G704-000573.2009.29.4.021.
- Yeom JH. 2014 A Comparison Study of Determinants for Mortality between Rural and Urban Older Adults. The Journal of Rural Society 24(2):161-195. http://uci.or.kr/G704-000099.2014.24.2.006
- Yu JH, Shin MS, Kim DJ, et al. 2013;Enhanced carbohydrate craving in patients with poorly controlled type 2 diabetes mellitus. Diabetic Medicine. 30(9):1080-1086. doi:10.1111/dme.12209.ArticlePubMed
References
Figure & Data
References
Citations
Citations to this article as recorded by 
- Association between Physical Activity and Perceived Stress among Korean Adults: A Cross-Sectional Study Using 2017 the Korea National Health and Nutrition Examination Survey Data
Jaeheon Heo
STRESS.2019; 27(4): 313. CrossRef - Changes in Depression and Stress of the Middle-Aged and Elderly through Participation in a Forest Therapy Program for Dementia Prevention
Jaeyoon Hong, Sujin Park, Jungwon Lee
Journal of People, Plants, and Environment.2019; 22(6): 699. CrossRef
 PubReader
-
 Cite
Cite
- CITE
-
- Close
- Download Citation
- Close
 XML Download
- Figure
-

- Related articles
-
- The Mediating Role of Sleep Problems in the Relationship between Economic Hardship and Quality of Life: A Short-Term Longitudinal Study
- The Dual Mediation Effect of Evaluative Concerns Perfectionism and Mindfulness in the Relationship between Temperament and Depression among Office Workers
- The Mediating Role of Anger Rumination in the Relationship between Job Stress and Problem Drinking among Community-Oriented Police Officers
- The Mediating Role of Smartphone Usage Time in the Relation between Stress and Anxiety among Adolescents during the COVID-19 Pandemic
- The Moderating Effect of Perceived Psychological Support on the Relationship between Perceived Disaster Damage, Posttraumatic Stress, and Subjective Health Status among Disaster Victims