
Articles
- Page Path
- HOME > STRESS > Volume 29(2); 2021 > Article
-
Original Article
식품 알레르기 아동의 건강 문제와 인지된 부모의 건강 상태와의 관계에서 양육 스트레스의 매개 효과 -
조영일
 , 김효진, 김동희
 - The Mediating Effects of Parenting Stress on the Relationship between the Health Problems of Children with Food Allergies and the Perceived Health Status of Parents
-
Young Il Cho, Hyo Jin Kim, Dong Hee Kim
-
stress 2021;29(2):115-121.
DOI: https://doi.org/10.17547/kjsr.2021.29.2.115
Published online: June 30, 2021
1 동국대학교 경찰사법대학 경찰행정학부
2 서울대학교 간호대학 대학원
3 성신여자대학교 간호대학
1Division of Police Administration, College of Police and Criminal Justice, Dongguk University, Seoul, Korea
2Graduate School, College of Nursing, Seoul National University, Seoul, Korea
3College of Nursing, Sungshin University, Seoul, Korea
- Corresponding author, Dong Hee Kim , Tel: +82-2-920-7727, Fax: +82-2-920-2091, E-mail: dhkim@sungshin.ac.kr
Copyright © 2021 by stress. All rights reserved.
This is an open-access article distributed under the terms of the Creative Commons Attribution Non-Commercial License (http://creativecommons.org/licenses/by-nc/4.0), which permits unrestricted non-commercial use, distribution, and reproduction in any medium, provided the original work is properly cited.
- 1,583 Views
- 54 Download
Key messages
- 본 연구는 식품 알레르기 아동의 건강 문제와 인지된 부모의 건강 상태와의 관계에서 양육 스트레스의 매개효과를 검증하고자 하였다. 알레르기를 진단받은 아동의 부모 80명을 대상으로 자가보고식 설문을 통해 아동의 식품 알레르기 특성, 자녀 건강에 대한 걱정, 부모의 건강 상태, 양육 스트레스를 조사하였고 경로분석을 활용하여 주요 변수의 구조적 관계와 양육 스트레스의 간접효과를 검증하였다. 자녀 건강 문제로 포함된 알레르기 유발 식품 개수, 자녀의 건강에 대한 걱정과 인지된 부모의 건강 상태 간의 양육 스트레스의 매개효과는 통계적으로 유의미하였다. 식품 알레르기 아동 부모의 양육 스트레스를 줄이는 것은 부모의 건강 상태를 높일 수 있는 중재로 제시될 수 있음을 확인하였다.
Abstract
-
Background
- Understanding and managing the health of children diagnosed with food allergies and their families are becoming increasingly important. The purpose of this study was to verify the mediating effect of parenting stress on the relationship between the health problems of children with food allergies and the perceived health status of parents.
-
Methods
- A self-report questionnaire was administered to 80 parents of children diagnosed with allergies to determine the child’s food allergy characteristics, concerns about the child’s health, parents’ health status, and parenting stress, through which the number of allergy-inducing foods, the structural relationship between health concerns about children, parenting stress, and perceived parental health status, and the indirect effects of parenting stress were verified.
-
Results
- Parenting stress statistically significantly mediated the relationship between children’s health problems and perceived health status of parent.
-
Conclusions
- Reducing the parenting stress of parents of children with food allergies can increase parents’ health status. Since parental health is an important factor in child management, it is suggested that parenting stress interventions be included in the comprehensive management of children with food allergies.
- 식품 알레르기는 아동, 청소년의 대표적인 알레르기 질환으로 세계적으로 알레르기 질환의 증가와 더불어 우리나라의 경우에도 최근 20여 년간 전반적으로 유병률이 증가하고 있다[1]. 식품 알레르기는 두드러기, 부종, 아나필락시스 등 다양한 증상이 발현되며 아동의 초기 영양 상태와 성장 발달에 큰 영향을 미친다[2]. 따라서 식품 알레르기를 진단받은 아동과 가족에 대한 이해와 관리가 점차 중요해지고 있다.
- 식품 알레르기 아동의 부모는 아동의 건강관리에 상당한 부분을 담당하게 된다. 자녀와 부모의 관계는 상호순환적이므로 건강하지 못한 부모의 상태는 아동의 신체적, 정서적 발달에 부정적 영향을 미치게 되고 알레르기 증상 악화의 원인이 되기도 한다[3,4]. 따라서 부모의 건강 상태는 부모 자신에게도 중요한 문제이며 또한 자녀에게도 영향을 주게 되므로 식품 알레르기 관리에서 중요하게 다루어져야 할 부분이다. 기존 연구에서도 식품 알레르기 아동의 부모는 우울, 불안 수준이 높고 건강 관련 삶의 질이 건강한 아동의 부모보다 낮은 것으로 나타났다[5,6]. 부모와 자녀를 비교한 연구에서도 실제 환아 본인보다 부모의 삶의 질이 더 낮은 것으로 조사되어[7], 이들 부모의 건강 상태에 보다 적극적인 관심을 기울어야 할 필요가 있음을 알 수 있다.
- 식품 알레르기 아동 부모의 건강 상태에 영향을 미치는 요인으로 아동의 건강 문제를 들 수 있다. 다른 만성 질환 아동 부모의 경우에도 아동 질환의 중증도, 인지된 건강 상태에 따라 부모의 신체적, 정신적 건강 상태에 영향을 받는다고 보고되어 왔다[8]. 식품 알레르기의 경우도 마찬가지로 아동의 아나필락시스 경험, 알레르기 조절 정도에 따라 부모의 건강과 삶의 질에 영향을 받는 것으로 보고되고 있다[9,10]. 이렇듯 스트레스 결과로서의 부모의 건강 상태에 영향을 주는 원인으로 아동의 건강 문제가 중요한 요인임을 알 수 있다. 따라서 본 연구에서는 선행연구를 분석하여 자녀의 건강 문제를 객관적 지표인 아동의 질병 특성과 주관적 지표인 자녀 건강에 대한 걱정을 포함하여 조작화하였다.
- 양육 스트레스는 자녀의 양육과 관련된 스트레스로 특히 식품 알레르기 아동의 부모는 많은 스트레스 상황을 경험한다. 부모는 아동의 식품 알레르기 증상이 호전과 악화를 반복하는 과정에서 응급약의 준비 및 사용 방법 숙지, 대체 식품 마련을 위한 다양한 활동 등 신체적, 시간적 양육 부담을 가지게 된다. 또한 지속적인 음식에 대한 의심과 불안, 식품과 관련된 사회 활동에서의 고립감, 자녀의 생명을 위협하게 되는 상황에 대한 두려움 등 다양한 심리적 양육 부담도 경험하게 된다[3,9]. 이렇게 정상 아동의 부모에 비해 더 많은 부분을 책임져야 하는 부담들은 이들 부모의 양육 스트레스를 높이게 된다[10,11]. 또한 이러한 양육 스트레스는 아동의 건강 상태가 나쁠수록 부모가 감당해야 하는 부분이 많아지고 아동의 상태에 대한 죄책감 등으로 높아질 수 있다[12]. 따라서 본 연구에서는 아동의 건강 문제, 부모의 건강 상태와의 관계에서 부모의 양육 스트레스를 매개 요인으로 가정한 모델을 기반으로 연구를 진행하였다.
- 식품 알레르기 아동의 부모는 아동의 증상 관리 및 발달에 중요한 영향을 미칠 수 있음에도 불구하고 지금까지 국내 연구에서는 부모의 건강 상태와 그 요인에 대한 연구는 미흡한 상태이다. 이에 본 연구에서는 식품 알레르기 아동 부모의 인지된 건강 상태에 영향을 미치는 아동의 건강 문제와 양육 스트레스와의 관계를 파악하여 효과적인 중재 방법을 개발하는데 기초자료를 제공하고자 한다.
서 론
- 1. 연구 설계
- 본 연구는 식품 알레르기를 진단 받은 자녀의 부모가 지각하는 자녀의 건강 문제, 인지된 부모의 건강 상태, 양육 스트레스 정도와 관계를 파악하고, 부모가 지각하는 자녀의 건강 문제와 인지된 부모의 건강 상태의 관계에서 양육 스트레스의 매개효과를 검증하기 위한 서술적 조사연구이다.
- 2. 연구 대상
- 본 연구는 서울 소재 일개 대학 부속 병원에서 피부 반응 검사 및 다중 알레르기 항원 검사를 통해 식품 알레르기를 진단받고 외래 진료를 위해 내원한 아동의 부모를 대상으로 하였다. 본 연구에서 활용한 측정 도구는 만 12세 이하 자녀를 둔 부모를 대상으로 개발되었으므로 만 12세 이하 아동의 부모로 대상자를 제한하였다. 또한 설문지 내용과 연구의 목적, 방법을 이해하고 자발적으로 연구 참여에 동의한 자를 선정기준으로 하였다. 대상자 수의 산정을 위해 G*power 3.1.9.2 프로그램을 사용하였으며 다중회귀분석을 위한 효과크기는 Cohen [13]의 기준에 따라서 f2을 기준으로 중간 크기(0.15)와 큰 크기(0.35)의 중간인 0.25로 설정하였다. 유의 수준 .05, 검정력 .95, 관련 예측요인 3으로 산정하였을 때 최소 73명이 산출되었으며 탈락률을 고려하여 80명을 대상으로 하였다. 추가적으로 본 연구에서는 연구문제를 검증하기 위하여 경로분석을 활용하였기 때문에, Kline [14]의 권고에 기초하여 경로모형의 연구자가 추정하는 추정값의 수인 7개의 10배인 70명을 초과하고 있음을 확인하였다. 결과적으로, 대상자 모집 및 자료 수집 과정에서 탈락 없이 최종 80명의 자료를 분석하였다.
- 3. 측정 도구
- 본 연구의 일반적 특성 및 아동의 질병 특성은 선행 연구를 분석하여 선정하였다. 대상자의 일반적 특성에는 성별, 연령, 종교 유무, 학력, 자녀수, 자녀의 식품 알레르기 치료에 대한 경제적 부담감을 포함하였다. 아동의 질병 특성은 아나필락시스 경험 유무, 알레르기 가족력, 동반 알레르기 질환 개수, 알레르기 유발 식품 개수, 식품 알레르기 증상의 수, 증상 양상을 포함하였다. 알레르기 유발 식품과 증상 양상은 Food Allergy Quality of Life Questionnaire for Parent Form (FAQLQ-PF)에서 제시된 항목을 기준으로 구성하였다. 질병 특성은 자료 분석시 아동의 건강 문제에 대한 객관적 지표로 사용하였다.
- 부모가 지각하는 자녀 건강에 대한 걱정은 식품 알레르기 아동과 부모의 삶의 질을 측정하기 위해 DunnGalvin 등[15]이 개발한 Food Allergy Quality of Life Questionnaire for Parent Form (FAQLQ-PF)을 원저자에게 사용에 대한 승인을 받아 관련 문항을 활용하였다. 식품 알레르기로 인한 자녀의 신체적 건강 상태에 대한 걱정 1문항, 정신적 건강 상태에 대한 걱정 1문항으로 구성되어 있다. 각 문항은 5점 Likert 척도로, 총 점수 범위는 2∼10점이고 점수가 높을수록 식품 알레르기로 인해 자녀 건강에 대한 걱정이 많은 것을 의미하며 본 연구에서 Cronbach’s α는 .85였다. 자녀 건강에 대한 걱정은 자료 분석시 아동의 건강 문제에 대한 주관적 지표로 활용하였다.
- 본 연구에서 인지된 부모의 건강 상태는 Food Allergy Qu-ality of Life Questionnaire for Parent Form (FAQLQ-PF) 에서 부모의 전반적인 건강 상태를 측정하는 단일 문항을 사용하였다. 본인의 건강에 대해 “매우 나쁨’ 1점에서 ”최상의 상태” 7점까지로 측정하는 Likert 척도이다. 점수가 높을수록 본인의 전반적인 건강 상태에 대해 긍정적으로 인식하고 있음을 의미한다.
- 본 연구에서는 Abidin [16]이 개발한 도구를 한국어로 표준화하여 신뢰도와 타당도가 검증된 한국판 부모 양육 스트레스 검사(Korean version of Parenting Stress Index- Short Form, K-PSI-SF)를 활용하였다[17]. K-PSI-SF는 부모 보고 형식으로 만 12세까지의 자녀를 둔 부모가 경험하는 양육 스트레스를 측정하는 척도이다. 부모의 고통, 부모-아동 역기능적 상호작용, 까다로운 아동의 3개 하위 요인을 포함하여 각 하위 척도 별로 12문항씩 총 36문항으로 구성되어 있다. 각 문항은 5점 Likert 척도로 K-PSI-SF의 점수 범위는 최저 36점에서 최고 180점이고, 점수가 높을수록 부모의 양육 스트레스가 높은 것을 의미한다. 본 도구의 한국어판 표준화 당시 Cronbach’s α는 .91이었으며, 본 연구에서는 .94였다.
- 4. 자료 수집
- 본 연구는 S병원 연구심의위원회의 승인(4-2019-0629)을 받은 후, 2019년 9월 26일부터 2019년 12월 9일까지 실시되었다. 어린이병원 원내 게시판에 대상자 모집을 위한 공고문을 게재하고 자녀의 외래 진료를 위해 대기하고 계신 부모님께 연구원이 연구에 대해 설명하여 대상자를 모집하였다. 연구에 참여하기로 구두 동의한 대상자에게 설명문과 동의서를 활용하여 연구 목적과 방법, 동의 철회, 개인정보 보호 등에 대한 내용을 설명하였으며 서면 동의를 받은 후, 설문지 작성을 하였다. 설문지 응답에 소요되는 시간은 약 15분이었다.
- 5. 자료 분석
- PASW software (version 19, SPSS Inc, Chicago, IL, USA)를 사용하여 자료를 통계 분석하였다. 대상자의 일반적 특성과 질병 관련 특성은 실수와 백분율로 분석하였고 주요 변수의 점수는 평균과 표준편차, 주요변수들 간의 상관관계는 Pearson correlation coefficient를 사용하여 분석하였다.
- 알레르기 유발 식품 개수, 자녀 건강에 대한 걱정, 양육 스트레스 및 인지된 부모의 건강 상태의 구조적 관계와 양육 스트레스의 간접효과를 검증하기 위하여 경로 분석(path analysis)을 활용하였다. 경로분석은 M-plus (version 8.0, Muthen & Muthen, Los Angeles, CA, USA)를 활용하여 경로계수를 추정하였다. 특히, 간접효과의 통계적 유의성을 검증하기 위하여 Bootstrapping 방법에 기초한 경험 분포(empirical distribution)를 활용한 95% 신뢰구간이 사용되었다. 본 연구의 연구모형은 2개의 예측변수, 1개의 매개변수, 1개의 결과변수를 가진 포화모형(saturated model)이기 때문에, 모형의 합치도 지수에 기초한 모형의 평가를 실시하지 않았다.
연구방법
1) 일반적 특성 및 아동의 질병 특성
2) 자녀 건강에 대한 걱정
3) 인지된 부모의 건강 상태
4) 양육 스트레스
- 1. 대상자의 일반적 사항과 아동의 질병 특성
- 연구 대상자의 일반적 사항과 아동의 질병 특성은 Table 1과 같다. 본 연구에 참여한 80명 중에서 어머니가 72명(90%), 아버지가 8명(10%)이었으며 평균 연령은 37.09± 4.09세였다. 종교가 있다고 응답한 대상자는 40명(50%)이었고, 교육 수준은 대학졸업이 53명(66.2%)으로 가장 많았다. 자녀 수가 1명인 경우가 42명(52.5%)이었고, 14명(17.5%)이 식품 알레르기에 대한 치료비 부담감을 느꼈다.
- 식품 알레르기 아동은 남아가 53명(66.2%)이었고, 평균 연령은 4.02±2.28세였다. 42명(52.5%)이 이전에 아나필락시스를 경험했으며, 61명(76.3%)이 식품 알레르기를 외에도 1개 이상의 알레르기 질환(알레르기성 비염, 천식, 아토피 피부염)이 있었다. 알레르기를 유발하는 식품 개수는 평균 2.85±2.01개, 식품 알레르기로 인한 증상의 수는 6.70±5.08개였다. 식품 알레르기의 평균 유병기간은 2.44±1.99년이었으며 알레르기 증상 양상은 구강 및 피부에 나타나는 경우가 33명(41.3%)이었다.
- 2. 인지된 부모의 건강 상태, 자녀 건강에 대한 걱정, 양육 스트레스 정도
- 연구 대상자가 지각하는 부모 건강 상태, 자녀 건강에 대한 걱정, 양육 스트레스는 Table 2와 같다. 대상자의 인지된 건강 상태는 평균 4.36±1.08, 자녀 건강에 대한 걱정은 평균 5.83±2.40, 양육 스트레스는 평균 79.05± 20.24로 나타났다. Kline [14]은 왜도의 기준을 절대값 3을 초과하지 않고, 첨도는 절대값 8 또는 10을 초과하지 않으면 정규분포로 볼 수 있다고 제시하였다. 본 연구모형에 포함된 변수들의 왜도와 첨도는 기준값을 초과하지 않아 정규성을 유지하고 있음을 확인하였다.
- 3. 인지된 부모의 건강상태, 자녀 건강에 대한 걱정, 식품 알레르기 특성, 양육 스트레스 간의 상관관계
- 주요 변수의 상관관계를 분석한 결과는 Table 3과 같다. 아동의 식품 알레르기 특성으로 알레르기 유발 식품 개수, 식품 알레르기 증상의 수, 식품 알레르기 유병 기간을 포함하였다. 대상자의 인지된 건강 상태는 자녀 건강에 대한 걱정(r=−.409, p<.001), 알레르기 유발 식품 개수(r=−.316, p=.005), 양육 스트레스(r=−.519, p<.001)와 유의한 상관관계가 있었다. 자녀 건강에 대한 걱정은 알레르기 유발 식품 개수(r=.276, p=.014), 식품 알레르기로 인한 증상의 수(r=.321, p=.004), 양육 스트레스(r=.402, p<.001)와 유의한 상관관계가 있었다. 또한 알레르기 유발 식품 개수는 식품 알레르기로 인한 증상의 수(r=.357, p=.001)와 양육 스트레스(r=.393, p<.001)와 상관관계가 있는 것으로 나타났다. 본 연구의 연구 모형에서 예측변수와 매개변수로 설정한 변수들 간의 상관계수는 절댓값 .40 이하로 다중공선성(multicollinearity)로 인한 문제를 유발하지 않을 수준이다[18].
- 4. 자녀 건강 문제와 인지된 부모 건강 상태와의 관계에서 양육 스트레스의 매개효과
- 자녀 건강 문제는 객관적 지표인 아동의 질병 특성과 주관적 평가인 자녀 건강에 대한 걱정을 포함하였다. 객관적 지표인 아동의 질병 특성 중 알레르기 유발 식품만이 인지된 부모 건강 상태와 상관관계가 있는 것으로 나타나 최종적으로 알레르기 유발 식품 개수를 모형에 포함시켰다.
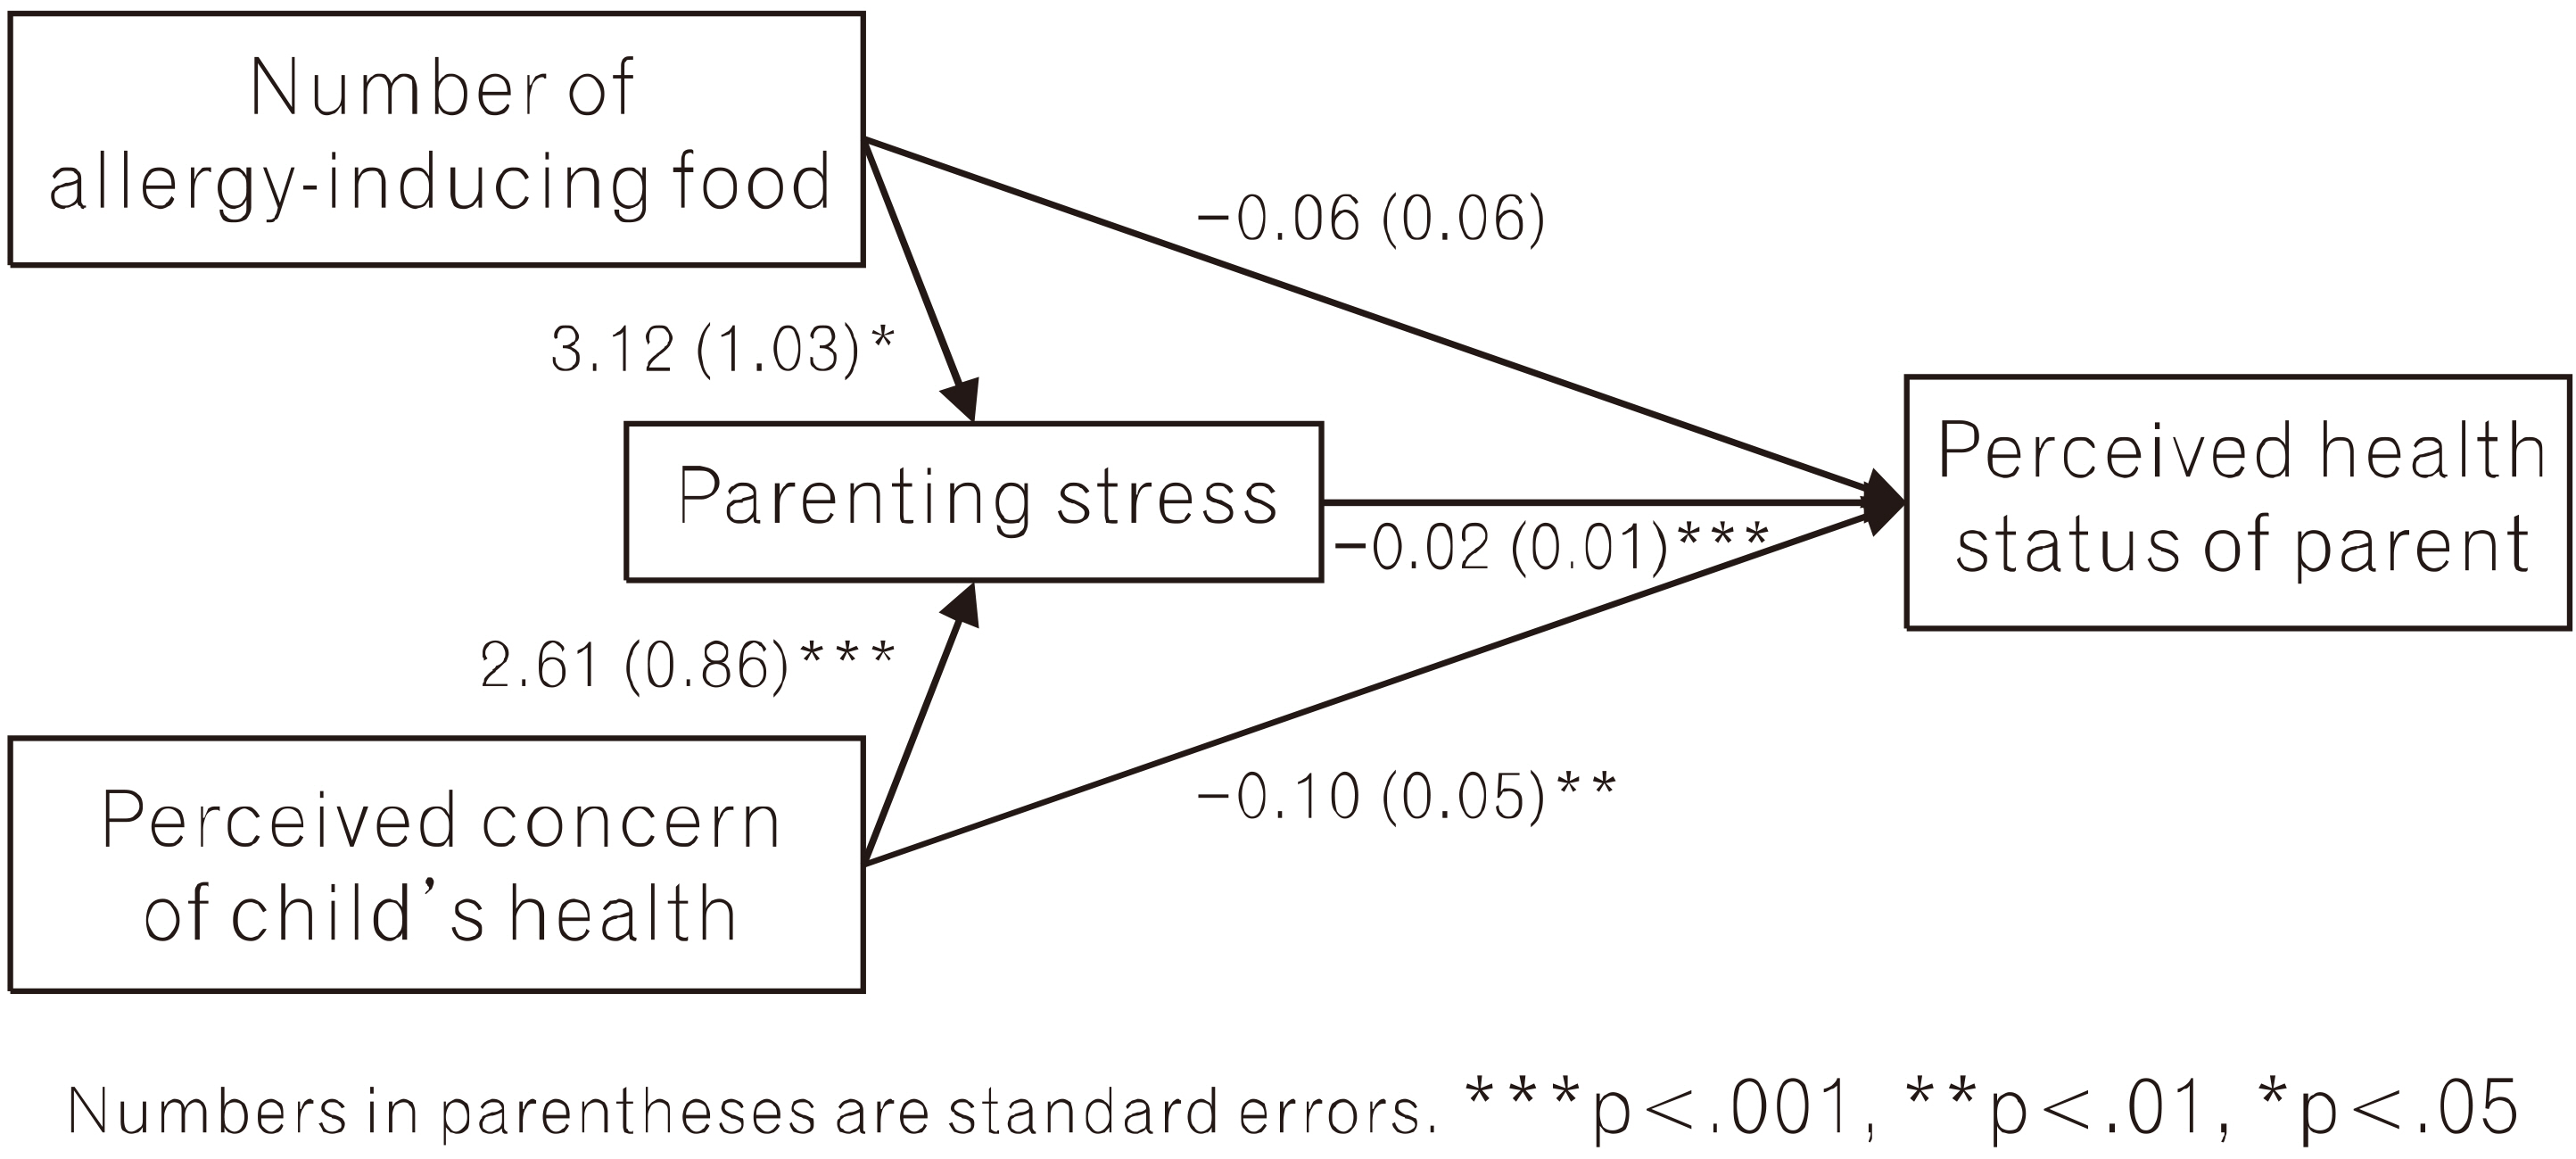
- 알레르기 유발 식품 개수, 자녀 건강에 대한 걱정, 양육 스트레스 및 지각된 부모의 건강 상태의 구조적 관계와 양육 스트레스의 간접효과를 검증하기 위하여 경로분석(path analysis)에서의 비표준화 경로계수 값은 Fig.1과 같다. 양육 스트레스는 알레르기 유발 식품 개수(β=0.31, p<.05)와 자녀 건강에 대한 걱정(β=0.31, p<.001)에 의해서 통계적으로 유의하게 정적으로 영향을 받았다. 추가적으로, 인지된 부모의 건강 상태는 알레르기 자녀 건강에 대한 걱정(β=−0.22, p<.01), 양육 스트레스(β=−0.39, p< .001)에 의해서 통계적으로 유의하게 부적인 영향을 받았다. 추가적으로, 본 2개의 예측변수(즉, 알레르기 유발 식품 개수와 자녀 건강에 대한 걱정)와 1개의 매개변수(양육 스트레스)를 가지는 연구모형은 인지된 부모의 건강상태의 분산 중 32%를 설명하고 있다.
- 알레르기 유발 식품 개수와 인지된 부모의 건강 상태 간의 양육 스트레스의 매개효과는 통계적으로 유의미하였다(b=−0.06, 95% CI=[−0.13, −0.02]). 즉, 알레르기 유발 식품 개수는 양육 스트레스를 통해서 인지된 부모의 건강 상태에 부적인 영향을 미쳤다. 자녀 건강 걱정과 인지된 부모의 건강 상태 간의 양육 스트레스의 매개효과는 통계적으로 유의미하였다(b=−0.05, 95% CI=[−0.11, −0.02]) (Table 4). 구체적으로, 자녀 건강에 대한 걱정은 양육 스트레스를 통해서 인지된 부모의 건강 상태에 부적인 영향을 미쳤다.
결 과
- 본 연구는 식품 알레르기 아동의 부모를 대상으로 인지된 부모의 건강 상태, 자녀 건강에 대한 걱정, 양육 스트레스 정도를 살펴보고 아동의 건강 문제가 인지된 부모의 건강 상태에 미치는 영향에서 부모의 양육 스트레스가 두 변인과의 관계를 매개하는지에 대해 검증하였다. 주요 결과 및 논의점은 다음과 같다.
- 첫째, 식품 알레르기 부모의 양육 스트레스는 약 79.1점으로 동일 도구를 사용하여 아토피 피부염 아동 부모를 대상으로 한 연구[19]의 75.1점, 미숙아 어머니를 대상을 한 연구[20]의 74.6점보다 높았다. 이는 식품 알레르기 아동의 부모가 자녀를 양육하면서 발생하는 스트레스가 다른 알레르기 질환이나 다른 건강 문제가 있는 아동보다 높을 수 있음을 시사한다. 식품 알레르기 자녀를 가진 부모는 자녀의 식품 알레르기 증상 예방과 증상의 처치 관리에서 발생하는 다양한 양육 스트레스를 받게 된다[21]. 게다가 증상 발현시 생명을 위협받을 수 있고 어떤 상황에서 위기 상황이 발생할지 알 수 없는 불확실성이 부모의 스트레스를 더욱 높게 만든다[10,22]. 이렇게 식품 알레르기 아동 부모의 스트레스가 다른 집단에 비해서 높을 수 있다는 점은 이들의 양육 스트레스 관리가 중요한 중재로 다루어져야 한다는 것을 나타낸다. 추후 다른 건강 문제가 있는 집단과 통계적으로 유의한 지를 비교할 수 있도록 연구를 설계하여 검증하고, 또한 구체적인 양육 스트레스 내용과 요인에 대한 심층적인 연구가 뒤따라 식품 알레르기 아동 부모의 양육 스트레스의 정도를 좀 더 확실하게 이해할 필요가 있다.
- 둘째, 아동의 객관적 건강 문제로 포함했던 아동의 질병 기간, 알레르기 증상의 수, 알레르기 유발 식품 수 중 알레르기 유발 식품 수가 인지된 부모의 건강 상태와 통계적으로 유의하게 상관관계가 있는 것으로 나타났다. 알레르기 유발 식품 수가 많아질수록 제한된 음식이 많아지고 자녀의 알레르기 반응 가능성이 커져 부모는 음식 준비, 사회활동 조절 등 일상생활 속에서 관리에 더 많은 에너지를 쏟아야 하므로 부모의 양육 스트레스가 높아지게 된다[23]. 그러므로, 알레르기 유발 식품이 여러 가지인 경우 관련 식품의 소개, 식품 교차 반응 등이 구체적으로 포함된 교육을 충분히 제공하는 것이 필요할 것으로 본다. 또한 본 연구에서 유의한 상관관계를 보이지 않은 질병 기간이나 알레르기 증상 수에 대한 내용도 질병기간을 세분화한 분석, 알레르기 반응 정도나 내용에 따른 분석이 뒤따라 구체적 관련 요인을 찾을 수 있는 연구를 제언한다.
- 셋째, 아동의 건강 문제로 포함한 알레르기 유발 식품 수와 자녀 건강에 대한 걱정 모두 양육 스트레스에 영향을 주는 것으로 나타났다. 이는 아동의 건강 문제가 양육 스트레스에 영향을 준다는 기존 연구와 일치한다[12,24]. 또한 본 연구에서 주목할 점은 아동의 건강 문제에 포함된 객관적 지표인 식품 알레르기 유발 식품 개수와 주관적 지표인 자녀 건강에 대한 걱정이 양육 스트레스에 미치는 영향의 회귀계수가 같게 나타나 두 변수가 양육 스트레스에 동일한 영향을 주었다는 점이다. 이는 아동의 건강에 대해 객관적 상태만큼 부모의 주관적인 판단도 중요하다는 것을 나타낸다. 부모가 인지하는 자녀 건강에 대한 취약성, 부정적 태도들이 만성질환을 가진 아동의 부모에게 나타나게 된다[25]. 이는 추후 자녀 양육시 과잉보호 등과 같이 부정적 양육 태도로 나타나게 되서 자녀의 건강, 성장발달이나 부모의 삶의 질 모두에 부정적 영향을 주게 된다[26]. 게다가 식품 알레르기 아동과 같이 만성적 건강 문제나 생명을 위협받는 아동의 증상을 관리하고 조절하면서 자녀의 건강에 대해 객관적 상태보다 더 과도한 걱정이나 부정적 판단을 할 수 있다. 그러므로, 식품 알레르기 아동의 부모가 자녀의 상태에 대해 객관적으로 올바르게 이해하고 대처하면서 자녀를 양육할 수 있도록 교육하고 중재하는 것이 반드시 필요하다고 본다.
- 넷째, 자녀 건강에 대한 걱정 변수가 인지된 부모의 건강 상태에 직접 효과를 나타내었다. 이는 자녀 건강에 대한 걱정과 인지된 부모의 건강 상태 간의 관계에서 본 연구에서 매개변수로 제시한 양육 스트레스 외에 추가적 매개변수가 존재한다는 것을 시사한다. 추후 양육 스트레스 외에 식품 알레르기 아동 부모의 건강 상태를 설명할 수 있는 추가적인 변수들을 탐색하는 추후 연구가 수행되어 식품 알레르기 아동을 돌보는 부모의 건강 상태에 대한 모델 구축과 건강을 증진시킬 수 있는 구체적인 중재 방법을 개발하도록 해야 할 것이다.
- 마지막으로, 양육 스트레스가 아동의 건강 문제와 인지된 부모의 건강 상태에 미치는 영향에서 매개 변인으로 작용함을 알 수 있었다. 본 연구의 결과는 건강 문제를 가진 아동 부모의 양육 스트레스가 부모의 신체적, 심리사회 건강의 매개 변인으로 나타난 기존 연구의 결과와 맥락을 같이 한다[27,28]. 이와 같이 양육 스트레스는 만성질환 아동과 부모의 적응에 부정적 영향을 미치는 것과 관련이 있는 변수로 알려져 있다[25]. 식품 알레르기 아동의 포괄적인 중재의 관점에서 가족 중심 중재 개발과 적용은 필수적이며 그 중 본 연구에서 중요한 변수로 나타난 부모의 양육 스트레스를 포함시키는 것이 중요하다. 자녀를 양육하면서 나타나는 전반적인 양육 스트레스 뿐 아니라 식품 알레르기 아동의 관리 과정에서 발생하는 다양한 양육 스트레스의 내용과 정도를 구체적으로 파악해야 한다. 이러한 내용을 바탕으로 양육 스트레스를 경감시키고 관리할 수 있는 교육 및 중재 프로그램의 개발이 필요할 것이다. 본 연구의 결과를 고려할 때, 식품 알레르기 아동의 부모를 대상으로 한 양육 스트레스 중재 프로그램은 부모의 건강 상태를 증진시킬 수 있을 것이다. 이를 통해 아동의 건강 상태, 나아가 가족의 건강성을 높이는데 기여할 것으로 본다.
- 본 연구의 제한점은 다음과 같다. 첫째, 부모의 건강 상태에 영향을 주는 다양한 변수를 포함하지 않았다. 본 연구에 변수로 포함한 양육 스트레스 외에 스트레스 모델에 포함되어 있는 부모의 대처 방법, 가족의 지지 등을 포함한 모델의 검증을 제언한다. 둘째, 부모의 건강 상태와 자녀 건강에 대한 걱정을 Food Allergy Quality of Life Questionnaire for Parent Form의 일부 항목을 활용하여 측정하였기 때문에 타 연구와의 비교가 가능하지 않았으며 구체적 건강문제에 대해 파악할 수 없었다. 따라서 추후 아동과 부모의 건강을 구체적으로 파악할 수 있는 신뢰도와 타당도가 검증된 단독 도구를 사용하여 결과를 도출할 것을 제언한다. 셋째, 본 연구는 일개 병원에서 실시하였으므로 연구의 결과를 일반화하는데 제한이 있다. 따라서 추후 여러 지역 및 기관에서 반복 연구가 이루어져 결과를 검증할 것을 제언한다.
- 위와 같은 제한점에도 불구하고 본 연구에서는 지금까지 국내 연구에서는 활발하게 다루어지지 않았던 식품 알레르기 부모의 건강 상태에 대해 이해하고 관련 변수들과의 관계를 살펴보았다는 점에서 의의가 있다. 식품 알레르기 아동의 효과적인 관리를 위해서는 아동의 일차적이며 직접적인 관리자인 부모의 역할은 참여는 무엇보다 중요하다고 볼 수 있다. 이러한 관점에서 아동의 증상 예방과 관리를 위해 가장 영향력 있고 중요한 요소는 부모의 건강 상태와 관련된 변수를 확인하는 일은 추후 식품 알레르기 아동 중재에서 가족 중심 중재로 개념을 확장해 나가고 또 그에 따른 폭 넓은 중재도 개발할 수 있을 것으로 본다.
고 찰
-
Conflicts of interest
The authors declared no conflict of interest.
-
Funding
This work was supported by the Sungshin Women’s University Research Grant of 2019.
Notes
- 1. Kim YH, Lee SY, Lee E, Cho HJ, Kim HB, Kwon JW, et al. 2016;The change in food allergy prevalence of elementary school children in Seoul since the last 20 years and the risk factor analysis. Allergy Asthma & Respiratory Disease. 4(4):276-283. doi: 10.4168/aard.2016.4.4.276Article
- 2. Ahn KM. 2018;The past, present, and future of the research on food allergy in Korean children. Allergy Asthma & Respiratory Disease. 6:44-51. doi: 10.4168/aard.2018.6.S1.S44Article
- 3. Lee ES, Kim KS. 2018;Parental burden of food-allergic children’s parents and influencing factors. Journal of Nutrition and Health. 51(2):140-152. doi: 10.4163/jnh.2018.51.2.140Article
- 4. Cortes A, Castillo A, Sciaraffia A. 2018;Food allergy: Children's symptom levels are associated with mothers' psycho-socio-economic variables. Journal of Psychosomatic Research. 104:48-54. doi: 10.1016/j.jpsychores.2017.11.009ArticlePubMed
- 5. Birdi G, Cooke R, Knibb R. 2016;Quality of life, stress, and mental health in parents of children with parentally diagnosed food allergy compared to medically diagnosed and healthy controls. Journal of Allergy. 1497375. doi: 10.1155/2016/1497375.ArticlePubMedPMC
- 6. Feng C, Kim JH. 2019;Beyond avoidance: The psychosocial impact of food allergies. Clinical Reviews in Allergy & Immunology volume. 57(1):74-82. doi: 10.1007/s12016-018-8708-x.Article
- 7. King RM, Knibb RC, Hourihane JO. 2009;Impact of peanut allergy on quality of life, stress and anxiety in the family. European Journal of Allergy and Clinical Immunology. 64(3):461-468. doi: 10.1111/j.1398-9995.2008.01843.x.ArticlePubMed
- 8. Cohn LN, Pechlivanoglou P, Lee Y, Mahant S, Orkin J, Marson A, et al. 2020;Health outcomes of parents of children with chronic illness: A systematic review and meta-analysis. Journal of Pediatrics. 218:166-177. doi: 10.1016/j.jpeds.2019.10.068.ArticlePubMed
- 9. Kajornrattana T, Sangsupawanich P, Yuenyongviwat A. 2018;Quality of life among caregivers and growth in children with parent-reported food allergy. Asian Pacific Journal of Allergy and Immunology. 36(1):22-26. doi: 10.12932/AP-160217-0024.ArticlePubMed
- 10. Lau GY, Patel N, Umasunthar T, Gore C, Warner JO, Hanna H, et al. 2014;Anxiety and stress in mothers of food-allergic children. Pediatric Allergy and Immunology. 25(3):236-242. doi: 10.1111/pai.12203.ArticlePubMed
- 11. Sicherer SH, Noone SA, Muñoz-Furlong A. 2001;The impact of childhood food allergy on quality of life. Annals of Allergy, Asthma, & Immunology. 87(6):461-464. doi: 10.1016/S1081-1206(10)62258-2.Article
- 12. Cousino MK, Hazen RA. 2013;Parenting stress among caregivers of children with chronic illness: A systematic review. Journal of Pediatric Psychology. 38(8):809-828. doi: 10.1093/jpepsy/jst049.ArticlePubMed
- 13. Cohen J. 2013, Statistical power analysis for the behavioral sciences. Taylor and Francis; Hoboken.
- 14. Kline RB. 2005, Principles and practice of structural equation modeling, second edition. Guilford Press; New York.
- 15. DunnGalvin A, de BlokFlokstra BM, Burks AW, Dubois AE, Hourihane JO. 2008;Food allergy QoL questionnaire for children aged 0-12 years: Content, construct, and cross-cultural validity. Clinical and Experimental Allergy. 38(6):977-986. doi: 10.1111/j.1365-2222.2008.02978.x.ArticlePubMed
- 16. Abidin RR. 1995, Parenting stress index, third edition: Professional manual. Psychological Assessment Resources. FL; Odessa.
- 17. Lee KS, Chung KM, Park JA, Kim HJ. 2008;Reliability and validity study for the Korean version of parenting stress index short form (K-PSI-SF). The Korean Journal of Woman Psychology. 13(3):363-377.Article
- 18. Cohen J, Cohen P, West SG, Aiken LS. 2013, Applied multiple regression/correlation analysis for the behavioral sciences. Routledge; New York.
- 19. Kim DH. 2011;Factors associated with parenting stress of mothers of school-aged children with atopic dermatitis. The Korean Journal of Stress Research,. 19(2):115-121.
- 20. Hwang HS, Kim HS, Yoo IY, Shin HS. 2013;Parenting stress in mothers of premature infants. Child Health Nursing Research. 19(1):39-48. doi: 10.4094/chnr.2013.19.1.39Article
- 21. Le TM, Zijlstra WT, van Opstal EY, Knol MJ, L’Hoir MP, Knulst AC, et al. 2013;Food avoidance in children with adverse food reactions: Influence of anxiety and clinical parameters. Pediatric Allergy Immunology. 24(7):650-655. doi: 10.1111/pai.12114.ArticlePubMed
- 22. Mandell D, Curtis R, Gold M, Hardie S. 2005;Anaphylaxis: How do you live with it? Health & Social Work. 30(4):325-335. doi: 10.1093/hsw/30.4.325.ArticlePubMed
- 23. Bollinger ME, Dahlquist LM, Mudd K, Sonntag C, Dillinger L, McKenna K. 2006;The impact of food allergy on the daily activities of children and their families. Annals of Allergy, Asthma, & Immunology. 96(3):415-421. doi: 10.1016/S1081-1206(10)60908-8.Article
- 24. Pinquart M. 2018;Parenting stress in caregivers of children with chronic physical condition-A meta-analysis. Stress Health. 34(2):197-207. doi: 10.1002/smi.2780.ArticlePubMed
- 25. Lemos MS, Lima L, Silva C, Fontoura S. 2020;Disease-related parenting stress in the post-treatment phase of pediatric cancer. Comprehensive Child and Adolescent Nursing. 43(1):65-79. doi: 10.1080/24694193.2019.1570393.ArticlePubMed
- 26. Hullmann SE, Wolfe-Christensen C, Ryan JL, Fedele DA, Rambo PL, Chaney JM, et al. 2010;Parental overprotection, perceived child vulnerability, and parenting stress: A cross-illness comparison. Journal of Clinical Psychology in Medical Settings. 17(4):357-365. doi: 10.1007/s10880-010-9213-4.ArticlePubMed
- 27. Lee MH, Matthews AK, Park CG, Vincent C, Hsieh K, Savage TA. 2020;Relationships among parenting stress, health-promoting behaviors, and health-related quality of life in Korean mothers of children with cerebral palsy. Research in Nursing & Health. 43(6):590-601. doi: 10.1002/nur.22074.ArticlePubMed
- 28. van der Geest IM, van den Heuvel-Eibrink MM, Passchier J, van den Hoed-Heerschop C, Pieters R, Darlington AS. 2014;Parenting stress as a mediator of parents' negative mood state and behavior problems in children with newly diagnosed cancer. Psychooncology. 23(7):758-765. doi: 10.1002/pon.3475.ArticlePubMed
References
Figure & Data
References
Citations
 PubReader
-
 Cite
Cite
- CITE
-
- Close
- Download Citation
- Close
 XML Download
- Figure
-

- Related articles
-
- The Mediating Role of Anger Rumination in the Relationship between Job Stress and Problem Drinking among Community-Oriented Police Officers
- The Effect of Perceived Stress on Drinking Problem of Korean College Students: From the Perspective of Escape Theory
- The Moderating Effect of Help-Seeking on the Relationship between Experience of School Violence and Internalizing Behaviors
- The Mediating Effect of Self-Compassion in the Relationship between Intolerance of Uncertainty and Worry
- The Mediating Effects of Shame Experience in the Relationship between Symptom Severity and Quality of Life in Individuals with Irritable Bowel Syndrome