Articles
- Page Path
- HOME > STRESS > Volume 32(1); 2024 > Article
-
Original Article
자살 생각과 혈중 카드뮴 농도와의 연관성: 제3기부터 제7기 국민건강영양조사를 기반으로 -
김선미1,2

- Association between Suicidal Ideation and Blood Cadmium Levels Based on the 3rd to 7th Korea National Health and Nutrition Examination Surveys
-
Sunmi Kim1,2
-
STRESS 2024;32(1):46-52.
DOI: https://doi.org/10.17547/kjsr.2024.32.1.46
Published online: March 28, 2024
1강원대학교 의과대학 가정의학교실 조교수
2강원대학교병원 가정의학과 조교수
1Assistant Professor, Department of Family Medicine, Kangwon National University College of Medicine, Chuncheon, Korea
2Assistant Professor, Department of Family Medicine, Kangwon National University Hospital, Chuncheon, Korea
- Corresponding author Sunmi Kim Department of Family Medicine, Kangwon National University Hospital, Kangwon National University College of Medicine, 156 Baengnyeong-ro, Chuncheon 24289, Korea Tel: +82-33-258-2401 Fax: +82-33-258-2165 E-mail: arpsm800@gmail.com
Copyright © 2024 Korean Society of Stress Medicine.
This is an Open Access article distributed under the terms of the Creative Commons Attribution Non-Commercial License (http://creativecommons.org/licenses/by-nc/4.0/) which permits unrestricted non-commercial use, distribution, and reproduction in any medium, provided the original work is properly cited.
- 1,321 Views
- 16 Download
Key messages
- 본 연구는 혈중 카드뮴 농도와 자살 생각 사이에 연관성이 존재하는지를 확인하기 위해 수행되었다. 제3∼7기 국민건강영양조사 자료로, 성인 남성과 여성 각각에서 자살 생각 여부에 따른 혈중 카드뮴 농도의 기하 평균을 다중선형회귀분석으로 비교하고, 혈중 카드뮴 농도에 따른 자살 생각 여부를 다중로지스틱회귀모형으로 분석하였다. 잠재적 교란요인을 모두 보정할 때, 남성과 여성 모두 자살 생각이 있는 경우가 없는 경우보다 혈중 카드뮴 농도의 기하평균이 유의하게 높았다. 또한 남성과 여성 모두 혈중 카드뮴 농도가 증가함에 따라 자살 생각의 빈도가 증가하는 양상을 보였으며, 이는 통계적으로도 유의하였다. 이번 연구 결과 우리나라 성인에서 혈중 카드뮴 농도와 자살 생각 사이에 명확한 연관성이 있음을 확인할 수 있었다.
Abstract
-
Background
- This study aimed to determine the association between blood cadmium levels and suicidal ideation.
-
Methods
- Using data from the 3rd to 7th Korea National Health and Nutrition Examination Surveys, the geometric mean of blood cadmium levels according to suicidal ideation was compared using multiple linear regression analyses in male and female adults. The frequency of suicidal ideation according to the blood cadmium levels was also compared using multiple logistic regression models.
-
Results
- In total, 6,877 men and 6,698 women were included in the study. When adjusting for all potential confounding factors, the geometric mean of blood cadmium levels was significantly higher in participants with suicidal ideation than in those without suicidal ideation in both men (0.92 ng/ml [95% confidence interval 0.87∼0.97 ng/ml] vs. 0.86 ng/ml [0.84∼0.88 ng/ml]; p=.026) and women (1.05 ng/ml [95% confidence interval 1.01∼1.10 ng/ml] vs. 0.99 ng/ml [0.98∼1.02 ng/ml]; p=.006). After adjusting for potential confounders, the frequency of suicidal ideation significantly increased as blood cadmium levels increased in men (p for trend=.014) and women (p for trend=.034).
-
Conclusions
- Results revealed an association between blood cadmium levels and suicidal ideation in Korean adults.
- 카드뮴은 독성을 가지는 중금속으로서, 10년 이상의 긴 체내 반감기를 가지기 때문에 장기간 노출 시 체내에 축적되어 광범위한 유해 작용을 나타낼 수 있다[1]. 카드뮴은 유방암, 폐암, 전립선암 등 다양한 암을 유발할 수 있고, 신장 독성과 간 독성을 가지며, 골다공증을 유발하는 등 다양한 신체적 독성을 나타낸다[2]. 카드뮴의 신경계 유해 작용 가능성도 보고되고 있는데, 소아 시기 카드뮴 노출이 인지 기능 발달에 악영향을 끼쳐 낮은 지능, 학습 장애, 행동 이상과 관련됨이 알려졌다[3]. 특히 최근에는 카드뮴이 우울증과 관련될 가능성이 제기되고 있는데, 높은 혈중 카드뮴 농도가 우울증과 연관이 있음이 여러 연구에서 보고되었다[4-7].
- 우울증은 자살과 밀접하게 연관되어 있는데, 자살 생각에 가장 강력한 영향을 미치는 요인이 우울증이다[8]. 우리나라의 경우 자살률이 2020년 기준 연 인구 10만 명당 24.1명으로서 경제협력개발기구 회원국 가운데 가장 높으며[9], 우리나라 사람 중 15.6%가 자살을 심각하게 고려해 본 적이 있다고 조사될 정도로, 우리나라에서 자살은 심각한 문제이다[8]. 높은 혈중 카드뮴 농도가 우울증 증가와 연관되어 있으므로, 카드뮴이 자살 위험을 증가시킬 가능성이 있을 것으로 추측해 볼 수 있으나, 이에 대한 연구 결과는 아직 찾아볼 수 없었다. 이에 본 연구는 국민건강영양조사 자료를 이용하여 우리나라 성인에서 혈중 카드뮴 농도와 자살 생각 사이에 연관성이 존재하는지를 확인하였다.
서 론
- 1. 연구 대상
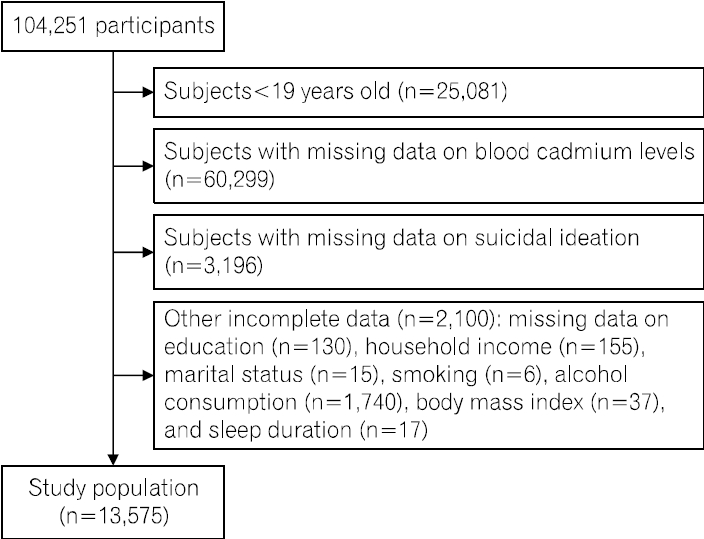
- 본 연구는 제3기부터 제7기까지 국민건강영양조사 자료를 이용하여 수행되었다. 국민건강영양조사에서 혈중 카드뮴 농도가 측정된 시기는 제3기(2005년), 제4기의 2차 및 3차 연도(2008년, 2009년), 제5기(2010∼2012년), 제6기의 1차 연도(2013년), 제7기의 1차 및 2차 연도(2016년, 2017년)였다. 따라서 본 연구는 해당 연도의 자료를 대상으로 하였다. 또한 보정이 필요한 주요 잠재적 교란변수들의 조사 연령을 고려하여 19세 미만은 연구 대상에서 제외하였다. 그중에서 혈중 카드뮴 농도 측정값이 결측인 경우, 자살 생각에 대한 조사 결과가 결측인 경우, 기타 교란변수들이 결측인 경우는 연구 대상에서 제외하고, 남은 13,575명을 대상으로 분석을 진행하였다(Fig. 1). 본 연구는 강원대학교병원 생명의학연구윤리 심의위원회의 심의면제 승인(KNUH-2024-01-014)을 받았으며, 헬싱키 선언의 윤리 기준에 부합하게 시행되었다.
- 2. 변수 정의
- 혈중 카드뮴 농도 분석은 헤파린 튜브를 이용해 채취된 혈액으로 네오딘의학연구소에서 수행하였으며, 원자흡광광도법(PerkinElmer AAnalyst 600, PerkinElmer, Finland)으로 측정되었다[10]. 자살 생각 여부는 “최근 1년 동안 심각하게 자살을 생각한 적이 있습니까?” 질문에 대한 예/아니오 답변에 의해 결정되었다. 조사 대상자의 나이는 30세 미만, 30세 이상 40세 미만, 40세 이상 50세 미만, 50세 이상 60세 미만, 60세 이상 70세 미만, 70세 이상으로 나누었다. 교육수준은 초등학교 졸업 이하, 중학교 졸업, 고등학교 졸업, 대학교 졸업 이상으로 분류하였다. 가구소득은 소득 4분위수를 기준으로 하, 중하, 중상, 상의 네 군으로 분류하였다. 거주지역은 대도시 지역과 그 이외 지역으로 나누었다[11]. 결혼상태는 미혼과 기혼 및 별거, 사별, 이혼으로 분류하였다[12]. 흡연은 평생 100개비 미만을 피운 경우 비흡연자, 과거에는 피웠으나 현재는 피우지 않는 경우 과거 흡연자, 현재도 계속 흡연 중인 경우는 현재 흡연자로 정의하였다[13]. 음주량의 경우 기존 연구에서와 같이 음주 빈도와 한 번에 마시는 음주량을 곱하여 알코올 섭취량을 계산하고[14], 하루 0 g, 0 g 초과 16 g 미만, 16 g 이상 40 g 이하, 40 g 초과로 분류하였다[15]. 체질량지수는 대한비만학회 가이드라인에 따라 18.5 kg/m2 미만, 18.5 kg/m2 이상 23 kg/m2 미만, 23 kg/m2 이상 25 kg/m2 미만, 25 kg/m2 이상 30 kg/m2 미만, 30 kg/m2 이상 35 kg/m2 미만, 35 kg/m2 이상으로 분류하였다[16]. 수면시간은 6시간 미만, 6시간 이상 8시간 이하, 8시간 초과로 분류하였다[12]. 주관적 체형 인식은 매우 마른 편, 약간 마른 편, 보통, 약간 비만, 매우 비만으로 분류하였다.
- 3. 통계 분석
- 국민건강영양조사는 우리나라를 대표하는 표본을 다단계층화집락확률추출 방법으로 추출하여 조사가 이루어지는데, 구체적으로 조사 시점에서 가용한 가장 최근의 인구주택총조사 자료를 기본 추출 틀로 하되 주민등록인구 및 아파트 단지 시세 조사 자료 등으로 이를 보완하여 추출틀을 마련하고, 이로부터 조사구 및 가구를 1, 2차 추출단위로 하는 2단계 층화집락표본추출방법을 사용하였다. 각 조사구 내에서는 계통추출법을 이용하여 표본 가구가 선정되었으며, 표본가구 내에서는 만 1세 이상의 모든 가구원이 조사 대상자로 선정되었다. 또한 조사 참여 대상이 우리나라 전체를 대표하도록 하기 위해 표본설계 시점과 조사 시점 간의 가구수 및 인구수 차이에 따른 포함오차, 불균등 추출률, 조사 미참여자의 무응답 오차 등을 보정하는 가중치 또한 산출된다[17]. 따라서 통계 분석 시에도 이러한 표본설계 구조를 반영할 수 있도록 표본의 가중치와 층, 집락을 모두 고려하는 복합표본분석 방법을 적용하였다. 혈중 카드뮴 농도 및 자살 생각의 분포가 둘 다 남성과 여성에서 명확한 차이를 보여 모든 분석은 남성과 여성으로 나누어 각각에서 시행하였다. 모든 통계 분석은 통계 패키지 R version 4.2.3 (the R foundation for statistical computing, vienna, austria)을 이용하여 수행되었으며, 양측 유의확률 .05 미만을 통계적 유의성의 기준으로 두었다.
- 연속형 변수에 대해서는 중앙값과 사분위수를 표준오차와 함께 제시하였고, 범주형 변수에 대해서는 각 범주의 추정 빈도 백분율 및 그 표준오차를 함께 제시하였다. 각 변수들의 분포가 자살 생각 여부에 따라 다른 지를 확인하기 위해, 연속형 변수의 경우 복합표본조사자료에 대한 설계기반 Kruskal-Wallis 검정을, 범주형 변수의 경우 Rao-Scott의 조정된 Pearson 카이제곱 검정을 시행하였다.
- 남녀 각각에서 자살 생각 여부에 따라 혈중 카드뮴 농도의 분포를 상자 그림을 그려 확인한 결과 기존 연구에서와 마찬가지로 비대칭적으로 우측으로 긴 꼬리를 가지는 분포를 보임을 확인할 수 있어, 회귀분석 과정에서 혈중 카드뮴 농도의 자연로그 변환 값을 이용하여 분석을 수행하였고, 따라서 대표 값으로 산술평균이 아닌 기하평균 값을 사용하였다[6].
- 자살 생각 여부에 따라 혈중 카드뮴 농도의 기하평균 값이 달라지는지 확인하고자, 자연로그 변환된 혈중 카드뮴 농도를 종속변수로 하고, 자살 생각 여부를 독립변수로 하는 다중선형회귀분석을 시행하고, 그로부터 자살 생각이 없는 군과 있는 군에서 혈중 카드뮴 농도의 기하평균 값을 추정하며, 이들의 값이 같은지 다른지에 대한 검정을 시행하였다. 다중선형회귀분석은 잠재적 교란 요인을 여러 방식으로 보정하며 수행하였는데, 보정할 잠재적 교란 변수들은 기존 연구를 참고하여 선정되었다[12,18,19]. 먼저 모형 1에서는 인구학적 변수인 나이만을 보정하여 분석을 시행하였고, 모형 2에서는 모형 1에서 포함된 변수에 사회경제적 요인들인 교육수준, 가구소득, 거주지역, 결혼상태, 가족 없이 혼자 지냄을 추가로 보정하여 분석을 시행하였으며, 모형 3에서는 모형 2에서 포함된 변수들에 건강행태 및 관련 요인들인 흡연, 음주량, 체질량지수, 수면시간, 주관적 체형 인식을 추가로 보정하여 분석을 시행하였다.
- 혈중 카드뮴 농도가 증가함에 따라 자살 생각의 빈도가 변화되는지를 확인하고자, 자살 생각 여부를 종속변수로 하고, 혈중 카드뮴 농도의 사분위군을 독립변수로 하는 다중로지스틱회귀분석을 시행하고, 혈중 카드뮴 농도가 가장 낮은 제1사분위군에 비해 제2, 제3, 제4사분위군에서 자살 생각의 빈도가 증가하는 양상을 보이는지를 검정하였다. 다중로지스틱회귀분석 역시 교란 요인을 여러 가지로 보정하며 수행했는데, 보정할 잠재적 교란 변수들은 마찬가지로 기존 연구를 참고하여 결정하였다[12]. 먼저 모형 1에서는 인구학적 변수인 나이만을 보정하여 분석을 시행하였고, 모형 2에서는 모형 1에서 포함된 변수에 사회경제적 요인들인 교육수준, 가구소득, 거주지역, 결혼상태, 가족 없이 혼자 지냄을 추가로 보정하여 분석을 시행하였으며, 모형 3에서는 모형 2에서 포함된 변수들에 건강행태 및 관련 요인들인 흡연, 음주량, 체질량지수, 수면시간, 주관적 체형 인식을 추가로 보정하여 분석을 시행하였다.
연구방법
- 전체 연구 대상자는 13,575명이었고, 그중 남성이 6,877명, 여성은 6,698명이었다. 이들의 전체적인 특성은 Table 1에 요약되어 있다. 남성에서 혈중 카드뮴 농도의 중앙값은 자살 생각이 없는 경우 0.882 ng/ml (표준오차 0.012 ng/ml), 있는 경우 1.090 ng/ml (표준오차 0.034 ng/ml)이었으며, 자살 생각이 있는 남성이 없는 남성에 비해 혈중 카드뮴 농도가 유의하게 높았다(p<.001) (Table 1). 여성에서 혈중 카드뮴 농도의 중앙값은 자살 생각이 없는 경우 1.049 ng/ml (표준오차 0.014 ng/ml), 있는 경우 1.154 ng/ml (표준오차 0.026 ng/ml)이었으며, 자살 생각이 있는 여성이 없는 여성에 비해 혈중 카드뮴 농도가 유의하게 높았다(p<.001) (Table 1).
- 남녀 각각에서 자살 생각 여부에 따라 혈중 카드뮴 농도의 분포를 확인하기 위해 상자 그림을 그린 결과 앞서 Table 1에서 얻어진 바와 같이 남녀 모두에서 자살 생각이 있는 경우에는 없는 경우보다 혈중 카드뮴 농도가 높은 양상을 확인할 수 있었다. 또한 혈중 카드뮴 농도의 분포는 비대칭적으로 우측으로 긴 꼬리를 가지는 분포가 보임을 확인할 수 있었다(Fig. 2).
- 나이만을 보정할 때 혈중 카드뮴 농도 기하평균은 자살 생각이 없는 남성의 경우 0.85 ng/ml (95% 신뢰구간 0.84∼0.87 ng/ml), 있는 남성의 경우 0.98 ng/ml(95% 신뢰구간 0.92∼1.04 ng/ml)로 추정되어, 자살 생각이 있는 경우가 없는 경우에 비해 1.15배(95% 신뢰구간 1.08∼1.22배) 더 컸으며, 이는 통계적으로 유의한 차이였다(p<.001) (Table 2). 나이, 교육수준, 가구소득, 거주지역, 결혼상태, 가족 없이 혼자 지냄, 흡연, 음주량, 체질량지수, 수면시간, 주관적 체형인식 모두를 보정할 때 혈중 카드뮴 농도 기하평균은 자살 생각이 없는 남성의 경우 0.86 ng/ml (95% 신뢰구간 0.84∼0.88 ng/ml), 있는 남성의 경우 0.92 ng/ml (95% 신뢰구간 0.87∼0.97 ng/ml)로 추정되어, 자살 생각이 있는 경우가 없는 경우에 비해 1.07배(95% 신뢰구간 1.01∼1.13배) 더 컸으며, 따라서 잠재적 교란 변수를 모두 보정한 후에도 자살 생각이 있는 남성의 혈중 카드뮴 농도 기하평균이 없는 경우보다 유의하게 컸다(p=.026) (Table 2, Fig. 3). 나이만을 보정할 때 혈중 카드뮴 농도 기하평균은 자살 생각이 없는 여성의 경우 0.99 ng/ml (95% 신뢰구간 0.97∼1.01 ng/ml), 있는 여성의 경우 1.09 ng/ml (95% 신뢰구간 1.05∼1.14 ng/ml)로 추정되어, 자살 생각이 있는 경우가 없는 경우에 비해 1.11배(95% 신뢰구간 1.06∼1.16배) 더 컸으며, 이는 통계적으로 유의한 차이였다(p<.001) (Table 2). 잠재적 교란요인을 모두 보정할 때 혈중 카드뮴 농도 기하평균은 자살 생각이 없는 여성의 경우 0.99 ng/ml (95% 신뢰구간 0.98∼1.02 ng/ml), 있는 여성의 경우 1.05 ng/ml (95% 신뢰구간 1.01∼1.10 ng/ml)로 추정되어, 자살 생각이 있는 경우가 없는 경우에 비해 1.06배(95% 신뢰구간 1.02∼1.10배) 더 컸으며, 따라서 잠재적 교란 변수를 모두 보정한 후에도 자살 생각이 있는 여성의 혈중 카드뮴 농도 기하평균이 없는 경우보다 유의하게 컸다(p=.006) (Table 2, Fig. 3).
- 나이만을 보정할 때 남성에서 혈중 카드뮴 농도 제1사분위군에 비해 제2, 제3, 제4사분위군에서 자살 생각의 오즈비는 각각 1.02 (95% 신뢰구간 0.72∼1.43), 1.55 (95% 신뢰구간 1.13∼2.13), 1.82 (95% 신뢰구간 1.34∼2.48)가 되어 증가하는 양상을 보였으며, 이는 통계적으로 유의하였다(p for trend<.001) (Table 3). 또한 잠재적 교란요인을 모두 보정할 때 남성에서 혈중 카드뮴 농도 제1사분위군에 비해 제2, 제3, 제4사분위군에서 자살 생각의 오즈비는 각각 0.95 (95% 신뢰구간 0.66∼1.38), 1.33 (95% 신뢰구간 0.94∼1.87), 1.42 (95% 신뢰구간 0.98∼2.04)가 되어 통계적으로 유의한 증가 양상을 보였다(p for trend=.014) (Table 3). 나이만을 보정할 때 여성에서 혈중 카드뮴 농도 제1사분위군에 비해 제2, 제3, 제4사분위군에서 자살 생각의 오즈비는 각각 1.20 (95% 신뢰구간 0.93∼1.54), 1.46 (95% 신뢰구간 1.12∼1.89), 1.67 (95% 신뢰구간 1.28∼2.17)이 되어 증가하는 양상을 보였으며, 이는 통계적으로 유의하였다(p for trend<.001) (Table 3). 또한 잠재적 교란 요인을 모두 보정할 때 여성에서 혈중 카드뮴 농도 제1사분위군에 비해 제2, 제3, 제4사분위군에서 자살 생각의 오즈비는 각각 1.16 (95% 신뢰구간 0.89∼1.50), 1.32 (95% 신뢰구간 1.00∼1.73), 1.33 (95% 신뢰구간 1.01∼1.75)이 되어, 혈중 카드뮴 농도가 증가할수록 오즈비가 통계적으로 유의하게 증가하는 양상을 보였다(p for trend=.034) (Table 3).
결 과
- 이번 연구 결과 혈중 카드뮴 농도와 자살 생각 사이에 명확한 연관성이 있음을 확인할 수 있었다. 성인 남성과 여성 모두에서 자살 생각이 있는 사람이 없는 사람보다 유의하게 혈중 카드뮴 농도가 높았으며, 이는 잠재적 교란 요인을 보정할 경우에도 변함없이 일관되게 유지되었다. 또한 성인 남성과 여성 모두에서 혈중 카드뮴 농도가 높아질수록 유의하게 자살 생각의 빈도가 높아지는 양상을 보였으며, 이 역시 잠재적 교란 요인을 보정한 이후에도 일관되게 유지되었다. 카드뮴과 우울증의 연관성에 대한 기존의 연구는 여럿 보고된 바 있으나[4-7], 카드뮴이 자살 생각과 연관이 있는지에 대한 과거 연구는 찾을 수 없었다. 따라서 이번 연구는 혈중 카드뮴 농도와 자살 생각 사이의 연관성을 직접적으로 확인한 최초의 연구로 판단되며, 과거 연구들이 카드뮴과 우울증 자체와의 연관성에 초점을 맞추었던데 반해[4-7], 이번 연구는 보다 심각한 상황인 자살 생각과 카드뮴의 연관성을 밝혀냈다는 점에서 의미가 있다. 그리고 이번 연구의 결과는 국민건강영양조사 자료를 분석한 결과 얻어진 것으로, 국민건강영양조사가 우리나라 전체를 대표할 수 있는 표본을 대상으로 이루어짐을 고려할 때, 이번 연구 결과 역시 우리나라 성인 전체로 곧장 확대 적용이 가능하다.
- 자살자의 90% 이상은 우울증이나 기타 정신질환을 가지고 있는 것으로 알려져 있고, 자살하여 사망한 사람을 부검해 보면 약 60%가 주요우울장애 또는 그 이외의 기분 장애를 경험한다고 알려져 있다[20]. 혈중 카드뮴 농도가 높아질수록 우울증의 빈도가 높아짐이 반복적으로 보고되고 있는데[4-7], 자살과 우울증 사이의 밀접한 관계를 고려한다면 카드뮴과 자살 생각 사이의 명확한 연관성을 입증한 이번 연구 결과는 기존 결과들과 일관된 것임을 확인할 수 있다. 우울증 이외에도 조현병과 양극성장애 역시 혈중 카드뮴 농도 증가와 연관됨이 보고된 바 있으며[21-23], 동물 실험에서는 지속적인 카드뮴 투여가 불안과 공격적 행동을 유발함이 보고되었다[24,25]. 우울증뿐만 아니라 조현병과 양극성장애, 불안장애와 공격성 또한 자살과 연관성이 높다는 사실이 잘 알려져 있으므로[20,26-29], 이번 연구에서 나타난 혈중 카드뮴 농도 증가와 자살 생각과의 연관성 역시 이러한 카드뮴에 의한 정신과적 변화와 관련이 있을 가능성이 있다.
- 카드뮴과 관련된 이러한 정신과적 변화의 기전은 아직 명확하지 않다. 그렇지만, 카드뮴은 혈뇌장벽을 통과하여 뇌 조직에서 세포내 축적이 일어나며 세포의 기능이상을 유발하는 것으로 알려져 있다[5]. 카드뮴은 세포내에서 산화 스트레스를 유발하여 미토콘드리아 기능을 저해하고 뇌 신경세포의 고사를 일으킨다고 보고되었다[6]. 뇌 피질에서의 카드뮴 농도 변화는 산화 균형에 영향을 주어 양극성장애 및 우울증에 영향을 줄 수 있을 것으로 생각된다[1]. 또한 카드뮴은 모노아민 신경전달 체계를 손상시키는 것으로 알려져 있는데, 카드뮴에 노출된 쥐는 뇌 조직 전반에서 세로토닌, 도파민, 노르에피네프린 함량이 감소됨이 알려져 있다[5]. 이러한 모노아민 신경전달 체계의 손상은 우울증 및 불안장애와 관련이 깊은 것으로 알려져 있는데, 따라서 카드뮴에 의한 카테콜아민, 세로토닌 신경전달체계의 작용 저해가 우울증 및 불안 유발의 원인이 될 가능성이 있다[5]. 그리고 카드뮴은 글리코겐 대사 이상을 유발하는 것으로 알려져 있는데, 장기간의 글리코겐 대사 이상은 신경퇴행 및 조현병과 연관된다[30].
- 카드뮴은 오염 물질로 주위 환경에 광범위하게 분포하고 있으며, 직업적 노출에 의해 신체 내로 들어올 수도 있는데, 카드뮴에 오염된 음식의 섭취가 노출 경로가 되기도 하지만, 또 하나의 중요한 노출 경로는 흡연이다[1]. 궐련한 개비의 카드뮴 함유량은 1∼2 μg이며, 흡연 시에는 이의 10%가량이 신체 내로 흡입이 된다[31]. 실제 흡연자는 하루 음식을 통해 섭취하는 카드뮴의 양과 유사한 수준의 카드뮴인 1∼3 μg 정도를 흡연을 통해 흡입하는 것으로 알려져 있으며[31], 흡연자의 혈중 카드뮴 농도는 비흡연자보다 4∼5배까지 더 높을 수도 있다[1]. 그런데, 흡연은 또한 우울증 및 자살 위험 증가와 연관되어 있음이 알려져 있다[32,33]. 따라서 이번 연구에서는 흡연을 교란 변수로 포함시켜 분석을 시행하였고, 흡연 및 다른 잠재적 교란요인을 모두 보정한 결과에서도 높은 혈중 카드뮴 농도는 자살 생각의 빈도 증가와 유의한 연관성을 보였다. 따라서 이번 연구에서 발견된 카드뮴과 자살 생각과의 연관성은 흡연과는 독립적으로 존재하는 것임을 확인할 수 있었다.
- 이번 연구에는 일부 한계점도 있었다. 첫째로 이번 연구는 국민건강영양조사 자료를 기반으로 수행되었는데, 국민건강영양조사는 우리나라 국민을 대표하는 표본을 조사하는 것이므로, 이번 연구의 결과를 다른 나라에까지 곧장 확대하여 적용하는 데는 무리가 있다. 둘째로 이번 연구는 국민건강영양조사 자료를 이용한 단면적 연구이므로 연관성을 확인할 수는 있지만, 인과성을 확인할 수는 없다.
- 결론적으로 이번 연구의 결과로부터 우리나라 성인에서 혈중 카드뮴 농도와 자살 생각 사이에 명확한 연관성이 있음을 확인할 수 있었다. 추후 이러한 연관성이 다른 나라에서도 확인되는지, 카드뮴과 자살 생각 사이에 인과성이 존재하는지 등에 대한 추가적인 연구가 필요할 것으로 보인다.
고 찰


Data are expressed as estimates for quartiles±standard errors for blood cadmium levels and as estimates for percentages±standard errors for the other variables. p-values were calculated by design-based Kruskal-Wallis test for complex sample survey data for blood cadmium levels and by Pearson chi square test with Rao-Scott adjustment for the other variables.
Data are expressed as estimates (95% confidence intervals) for geometric means of blood cadmium levels. The estimates and p-values were calculated by multiple linear regression models. Model 1: adjusted for age; Model 2: adjusted for age, education, household income, region of residence, marital status, and living alone without family members; Model 3: adjusted for age, education, household income, region of residence, marital status, living alone without family members, smoking, alcohol consumption, body mass index, sleep duration, and perceived body image.
Data are expressed as estimates (95% confidence intervals) for adjusted odds ratios. The estimates and p-values were calculated by multiple logistic regression models. Model 1: adjusted for age; Model 2: adjusted for age, education, household income, region of residence, marital status, and living alone without family members; Model 3: adjusted for age, education, household income, region of residence, marital status, living alone without family members, smoking, alcohol consumption, body mass index, sleep duration, and perceived body image.
- 1. Cybulska AM, Grochans S, Kamińska MS, Bosiacki M, Skonieczna-Żydecka K, Grochans E. Are cadmium and lead levels linked to the development of anxiety and depression? - A systematic review of observational studies. Ecotoxicology and Environmental Safety. 2021;216:11221. https://doi.org/10.1016/j.ecoenv.2021.112211Article
- 2. Genchi G, Sinicropi MS, Lauria G, Carocci A, Catalano A. The effects of cadmium toxicity. International Journal of Environmental Research and Public Health. 2020;17(11):3782. https://doi.org/10.3390/ijerph17113782ArticlePubMedPMC
- 3. Gustin K, Tofail F, Vahter M, Kippler M. Cadmium exposure and cognitive abilities and behavior at 10 years of age: A prospective cohort study. Environment International. 2018;113:259-268. https://doi.org/10.1016/j.envint.2018.02.020ArticlePubMed
- 4. Berk M, Williams LJ, Andreazza AC, Pasco JA, Dodd S, Jacka FN, et al. Pop, heavy metal and the blues: Secondary analysis of persistent organic pollutants (POP), heavy metals and depressive symptoms in the NHANES National Epidemiological Survey. BMJ Open. 2014;4(7):e005142. https://doi.org/10.1136/bmjopen-2014-005142ArticlePubMedPMC
- 5. Scinicariello F, Buser MC. Blood cadmium and depressive symptoms in young adults (aged 20-39 years). Psychological Medicine. 2015;45(4):807-815. https://doi.org/10.1017/S0033291714001883ArticlePubMedPMC
- 6. Nguyen HD, Oh H, Hoang NHM, Jo WH, Kim MS. Environmental science and pollution research role of heavy metal concentrations and vitamin intake from food in depression: A national cross-sectional study (2009-2017). Environmental Science and Pollution Research International. 2022;29(3):4574-4586. https://doi.org/10.1007/s11356-021-15986-wArticlePubMedPMC
- 7. Kim DH. Total blood heavy metal and depression among adult in Korea. [master’s thesis]. Seoul: Yonsei University; 2017.
- 8. Kim SY, Jung MY, Kim KN. Factors associated with suicidal ideation by age group among Korean adults using the fifth Korea National Health and Nutrition Examination Survey(KNHANES V, 2012). Korean Journal of Health Education and Promotion. 2014;31(2):1-14. https://doi.org/10.14367/KJHEP.2014.31.3.39Article
- 9. Organization for Economic Cooperation and Development. OECD health data: Suicide rates (indicator) [Internet] Paris, Organization for Economic Cooperation and Development; 2024 [cited 2024 February 04]. Available from: https://data.oecd.org/healthstat/suicide-rates.htm
- 10. Shin JY, Kim JM, Kim Y. The association of heavy metals in blood, fish consumption frequency, and risk of cardiovascular diseases among Korean adults: The Korean National Health and Nutrition Examination Survey (2008-2010). Korean Journal of Nutrition. 2012;45(4):347-361. https://doi.org/10.4163/kjn.2012.45.4.347Article
- 11. Cheng HM, Kim S, Park GH, Chang SE, Bang S, Won CH, et al. Low vitamin D levels are associated with atopic dermatitis, but not allergic rhinitis, asthma, or IgE sensitization, in the adult Korean population. Journal of Allergy and Clinical Immunology. 2014;133(4):1048-1055. https://doi.org/ 10.1016/j.jaci.2013.10.055ArticlePubMed
- 12. Cheon Y, Park J, Jeong BY, Park EY, Oh JK, Yun EH, et al. Factors associated with psychological stress and distress among Korean adults: The results from Korea National Health and Nutrition Examination Survey. Scientific Reports. 2020;10(1):15134. https://doi.org/10.1038/s41598-020-71789-yArticlePubMedPMC
- 13. Kim S. Association between atopic dermatitis and hyperuricemia in the adult Korean population based on the 7th and 8th Korea National Health and Nutrition Examination Survey. Korean Journal of Health Promotion. 2023;23(4):198-208. http://dx.doi.org/10.15384/kjhp.2023.23.4.198ArticlePDF
- 14. Lee B, Ha J. The effects of smoking and drinking on blood lead and cadmium levels: Data from the fourth Korea National Health and Nutrition Examination Survey. Korean Journal of Occupational and Environmental Medicine. 2011;23(1):31-41.ArticlePDF
- 15. Lee MY, Kim MY, Kim SY, Kim JH, Kim BH, Shin JY, et al. Association between alcohol intake amount and prevalence of metabolic syndrome in Korean rural male population. Diabetes Research and Clinical Practice. 2010;88(2):196-202. https://doi.org/10.1016/j.diabres.2010.12.009ArticlePubMed
- 16. Kim BY, Kang SM, Kang JH, Kang SY, Kim KK, Kim KB, et al. 2020 Korean Society for the study of obesity guidelines for the management of obesity in Korea. Journal of Obesity & Metabolic Syndrome. 2021;30(2):81-92. https://doi.org/10.7570/jomes21022ArticlePubMedPMC
- 17. Kweon S, Kim Y, Jang MJ, Kim Y, Kim K, Choi S, et al. Data resource profile: The Korea National Health and Nutrition Examination Survey (KNHANES). International Journal of Epidemiology. 2014;43(1):69-77. https://doi.org/10.1093/ije/dyt228ArticlePubMedPMC
- 18. Hwang IC, Ahn HY. High cadmium levels in individuals with depressive mood: Results from the 2008-2013 Korean National Health and Nutrition Survey. Iranian Journal of Public Health. 2021;50(8):1595-1602. https://doi.org/10.18502/ijph.v50i8.6805ArticlePubMedPMC
- 19. Lee JW, Kim Y, Kim Y, Yoo H, Kang HT. Cigarette smoking in men and women and electronic cigarette smoking in men are associated with higher risk of elevated cadmium level in the blood. Journal of Korean Medical Science. 2020;35(2):e15. https://doi.org/10.3346/jkms.2020.35.e15ArticlePubMedPMC
- 20. Jeon HJ. Depression and suicide. Journal of the Korean Medical Association. 2011;54(4):370-375. https://doi.org/10.5124/jkma.2011.54.4.370Article
- 21. Arinola G, Idonije B, Akinlade K, Ihenyen O. Essential trace metals and heavy metals in newly diagnosed schizophrenic patients and those on anti-psychotic medication. Journal of Research in Medical Sciences. 2010;15(5):245-249.PubMedPMC
- 22. Karim P, Hossain MI, Sadat AFMN, Nahar Z, Hossain MK, Hasnat A. Serum levels of cadmium, calcium, lead and iron in schizophrenic patients. Dhaka University Journal of Pharmaceutical Sciences. 2006;5(1-2):9-13.ArticlePDF
- 23. Gonzalez-Estecha M, Trasobares EM, Tajima K, Cano S, Fernandez C, Lopez JL, et al. Trace elements in bipolar disorder. Journal of Trace Elements in Medicine and Biology. 2011;25 Suppl 1:S78-83. https://doi.org/10.1016/j.jtemb.2010.10.015ArticlePubMed
- 24. Lamtai M, Chaibat J, Ouakki S, Berkiks I, Rifi El-H, El Hessni A, et al. Effect of chronic administration of cadmium on anxiety-like, depression-like and memory deficits in male and female rats: Possible involvement of oxidative stress mechanism. Journal of Behavioral and Brain Science. 2018;8:240-268. https://doi.org/10.4236/jbbs.2018.85016Article
- 25. Tercariol SG, Almeida AA, Godinho AF. Cadmium and exposure to stress increase aggressive behavior. Environmental Toxicology and Pharmacology. 2011;32(1):40-45. https://doi.org/10.1016/j.etap.2011.03.005ArticlePubMed
- 26. Hawton K, Sutton L, Haw C, Sinclair J, Deeks JJ. Schizophrenia and suicide: Systematic review of risk factors. The British Journal of Psychiatry. 2005;187:9-20. https://doi.org/10.1192/bjp.187.1.9ArticlePubMed
- 27. Dome P, Rihmer Z, Gonda X. Suicide risk in bipolar disorder: A brief review. Medicina (Kaunas). 2019;55(8):403. https://doi.org/10.3390/medicina55080403ArticlePubMedPMC
- 28. Kanwar A, Malik S, Prokop LJ, Sim LA, Feldstein D, Wang Z, et al. The association between anxiety disorders and suicidal behaviors: A systematic review and meta-analysis. Depression and Anxiety. 2013;30(10):917-929. https://doi.org/10.1002/da.22074ArticlePubMed
- 29. Gvion Y, Apter A. Aggression, impulsivity, and suicide behavior: A review of the literature. Archives of Suicide Research. 2011;15(2):93-112. https://doi.org/10.1080/13811118.2011.565265ArticlePubMed
- 30. Arruebarrena MA, Hawe CT, Lee YM, Branco RC. Mechanisms of cadmium neurotoxicity. International Journal of Molecular Sciences. 2023;24(23):16558. doi: 10.3390/ijms242316558ArticlePubMedPMC
- 31. Nawrot TS, Staessen JA, Roels HA, Munters E, Cuypers A, Richart T, et al. Cadmium exposure in the population: From health risks to strategies of prevention. Biometals. 2010;23(5):769-782. https://doi.org/10.1007/s10534-010-9343-zArticlePubMed
- 32. Quattrocki E, Baird A, Yurgelun-Todd D. Biological aspects of the link between smoking and depression. Harvard Review of Psychiatry. 2000;8(3):99-110.ArticlePubMed
- 33. Poorolajal J, Darvishi N. Smoking and suicide: A meta-analysis. PLoS One. 2016;11(7):e0156348. https://doi.org/10.1371/journal.pone.0156348ArticlePubMedPMC
 PubReader
 ePub Link
 Cite
Cite