
Articles
- Page Path
- HOME > STRESS > Volume 27(1); 2019 > Article
-
ORIGINAL ARTICLE
당뇨노인 인지기능의 이질적 변화 궤적에 대한 연구 -
김찬희
 , 김민정, 박창기
 - Heterogeneous Trajectories of Cognitive Function in Older Adults with Diabetes: Findings from the Korean Longitudinal Study of Aging (KLoSA)
-
Chanhee Kim, Min Jung Kim, Chang Gi Park
-
Korean Journal of Stress Research 2019;27(1):1-8.
DOI: https://doi.org/10.17547/kjsr.2019.27.1.1
Published online: March 31, 2019
- Corresponding author Min Jung Kim College of Nursing, The University of Illinois at Chicago, 845 S. Damen Ave., Chicago, IL 60612, USA Tel: +1-217-420-4909 Fax: +1-312-996-8945 E-mail: mkim315@uic.edu
• Received: February 11, 2019 • Revised: March 6, 2019 • Accepted: March 6, 2019
Copyright: © The Korean Journal of Stress Research
This is an open access article distributed under the terms of the Creative Commons Attribution Non-Commercial License (http://creativecommons.org/licenses/by-nc/4.0) which permits unrestricted non-commercial use, distribution, and reproduction in any medium, provided the original work is properly cited.
- 1,763 Views
- 50 Download
- 2 Crossref
Key messages
-
Background:
- Given the rapidly aging population and increasing diabetes prevalence in Korea and worldwide, maintaining optimal cognitive function is a concern in older adults with diabetes. This study aimed to identify heterogeneous trajectories of cognitive function in older adults with diabetes based on the Mini-Mental State Examination and characterize these trajectories.
-
Methods:
- Study participants consisted of 672 community-dwelling Korean older adults with diabetes, and data were obtained from the population-based Korean Longitudinal Study of Aging from 2006 through 2016. Growth mixture modeling (GMM) was employed to identify distinct trajectories of cognitive function in older adults with diabetes.
-
Results:
- We found that older adults with diabetes followed five distinct cognitive function trajectories over 10 years: normal-maintained (41.5%), normal-declined (23.8%), mildly impaired-maintained (17.1%), mildly impaired-declined (11.2%), and severely impaired-declined (6.4%). Also, we found that age, gender, household income, and self-rated health status at baseline were associated with these trajectories.
-
Conclusions:
- Our identification and characterization of heterogeneous cognitive function trajectories in older adults with diabetes have significant implications for developing tailored interventions to older adults with diabetes, specifically to whom at heightened risk for cognitive decline and consequent deterioration in essential diabetes self-management activities.
Abstract
- 본 연구는 지역사회 거주 당뇨노인의 인지기능의 변화궤적 양상을 확인하고자 하였다. 한국복지패널 1차년도부터 6차년도 자료를 활용하여, 당뇨진단을 받은 65세 이상의 노인 672명의 자료를 분석하였 다. 성장혼합모형 분석 결과, 당뇨노인의 인지기능의 변화양상은 ‘정상-유지형’ (41.5%), ‘정상-저하형’ (23.8%), ‘경도인지장애-유지형’ (17.1%), ‘경도인지장애-저하형’ (11.2%), ‘중증인지장애-저하형’ (6.4%) 의 5가지 유형으로 확인되었고, 연령, 성별, 가계소득, 자기보고 건강상태가 영향 요인으로 확인되었다. 본 연구 결과를 통해 당뇨노인의 인지기능의 변화 양상은 이질적이며, 당뇨노인의 인지기능 저하를 예방 하기 위해 대상자에 대한 개별적인 이해와 맞춤형 중재가 필요함을 확인할 수 있었다.
- In 2018, people aged 65 and over accounted for 14.3% of the South Korean population, and by 2060, the elderly will constitute 41% of the population (Statistics Korea, 2018). This phenomenon is especially concerning as the prevalence of chronic diseases also increases with age. Diabetes in particular is one of the most prevalent chronic conditions and the fifth leading cause of death in the older adult population (Statistics Korea, 2017). The prevalence of diabetes has been increasing in Korea for the last 10 years. This trend has been especially pronounced in adults aged 70 years and above, among whom the prevalence of diabetes in 2013 (27.6%) was almost double that in 2001 (15.1%) (Noh JH, 2016). Globally, Korea’s population is aging at the second-greatest rate (Organisation for Economic Co-operation and Development (OECD, 2016), and thus the population of Korean older adults diagnosed with diabetes is expected to continue growing.
- Diabetes has been linked to mild to severe cognitive impairment, although its etiologic mechanisms have not been confirmed. Some researchers have claimed that pathophysiological processes of diabetes, such as insulin resistance, vascular dysfunction, and inflammatory changes of brain vessels, could contribute to deterioration of cognitive function in this population (Roberts et al., 2014; Umegaki, 2014). A meta-analysis of longitudinal studies also found that people with diabetes had higher relative risks (RR) for mild cognitive impairment (MCI) (RR 1.21), Alzheimer’s disease (RR 1.46), vascular dementia (RR 2.48), and any dementia (RR 1.51) than those without diabetes (Cheng et al., 2012).
- Intact cognitive function, however, is necessary for individuals to successfully manage their diabetes, maintain their overall health and functional status, and reduce the risks for long-term diabetes complications (Tomlin et al., 2016; American Diabetes Association (ADA, 2018). Once cognitive impairment develops, it hinders older people with diabetes from actively engaging in diabetes self-management behaviors such as glucose monitoring, insulin dose adjustment, and planning a timely and healthy diet (ADA, 2018). Consequently, older adults with cognitive impairment are exposed to an increased risk for diabetes complications resulting from poor glycemic control (Tomlin et al., 2016; ADA, 2018).
- The severity, pattern, and progression of loss of cognitive function in older adults with diabetes are heterogeneous, as not everyone’s function deteriorates at the same rate and in the same pattern (Hayden et al., 2011). However, to our knowledge, most previous longitudinal studies to date have examined the average cognitive change at a population-level without capturing individual-level heterogeneity. Growth mixture modeling (GMM) is a person-oriented approach that allows identification of subgroups within heterogeneous populations based on similar patterns of change over time (Muthén et al., 1999; Nagin, 2005). This person- oriented approach views individuals holistically, while the variable-oriented approach (i.e., correlation, regression, and structural equation modeling) views individuals as a sum of variables (Bergman et al., 2006). With application of GMM’s person-oriented approach, healthcare providers can identify patterns of change in cognitive function among older adults with diabetes. The identification and characterization of cognitive function trajectories in older adults with diabetes will provide a foundation for healthcare providers to develop individually tailored interventions.
- Consequently, the aim of this study was to (a) identify distinct trajectory patterns of cognitive function in older adults with diabetes using a Korean population‐based cohort sample and (b) examine associations between cognitive function trajectory and baseline characteristics, including demographics, socioeconomic status, health status, health behavior, and functional status.
Introduction
- 1. Participants
- Data were collected from six waves of the Korean Longitudinal Study of Aging (KLoSA) conducted biannually from 2006 through 2016. The KLoSA was initiated to collect nationally representative longitudinal data on community-dwelling adults aged 45 years or more by means of multistage stratified probability sampling on the basis of geographical areas. In 2006, after providing written informed consent, 10,254 participants completed interviews performed by a trained interviewer (Boo et al., 2006). The data collected address a comprehensive range of demographic, socioeconomic, and health-related issues.
- Of the 10,254 adults interviewed in 2006, follow-up was conducted with 6,618 individuals in 2016. Of the 6,618 adults, 2,454 who were less than 65 years of age were excluded for the purposes of the current study. Among the remaining 4,164 adults aged 65 years or older, 672 had reported that they had diabetes and provided complete data at baseline in 2006. Thus, the final sample of our study was composed of 672 older adults with diabetes.
- 2. Measures
- Demographic variables considered for this study included baseline self-reported age, gender, marital status (married vs. unmarried—i.e., widowed, divorced, separated, or never married), education level (less than high school vs. high school or higher education), and income (total annual household income).
- Study participants’ cognitive function was examined using the Korean version of the Mini-Mental State Examination (K-MMSE) (Kang YW et al., 1997). On this scale, total scores range from 0 to 30, with lower scores reflecting poorer cognitive function. Scores of 24 and above indicate normal cognitive function, 18 through 23 indicate mildly impaired cognitive function, and 17 and below indicate severe impairment (Tombaugh et al., 1992; Park JH et al., 1996).
- Health status variables included the duration of diabetes; the presence of hypertension, heart disease, and cerebrovascular disease; the number of chronic conditions; depressive symptoms; self-rated health status. Depressive symptoms were assessed using the 10-item Center for Epidemiologic Studies Depression Scale (CES-D) (Andresen et al., 1994). The total CES-D score ranges from 0 to 10, with a higher score indicating more severe depressive symptoms. Self-rated health was dichotomized as poor (reports of poor and very poor) and good (reports of very good, good, and average). As for health behavior variables, self-reported current smoking, alcohol use, and regular exercise were assessed in addition to calculated BMI.
- Finally, to assess the functional status of the study participants, grip strength was evaluated using a handgrip dynamometer (Model number: NO6103; TANITA, Japan). Specifically, both hands’ grip strength was used to calculate an average grip strength for each participant. Additionally, the 10-item Korean Activities of Daily Living (K-ADL) scale was used to assess functions of daily activities such as eating, dressing, washing face and hands, bathing, performing transfers, using the toilet, and continence (Won CW et al., 2002). For the purposes of this study, respondents’ level of performance of each of these activities was recoded (0=needed no assistance, 1=needed partial or full assistance), and the total of the ADL scores ranged from 0 to 7, with higher scores reflecting greater functional limitations.
- 3. Analysis
- Data were analyzed using SPSS 21.0 (IBM SPSS Statistics for Windows, Armonk, NY, USA) and STATA TRAJ (Stata Corp., College Station, TX, USA). Baseline characteristics of the study participants were summarized using means (with standard deviations [SD]) or frequencies (percentages). Using the longitudinal cohort data, growth mixture modeling (GMM) was employed to identify cognitive function trajectories in older adults with diabetes. GMM was developed to identify differing homogeneous subpopulations with similar growth trajectories (latent classes) within longitudinal data from a heterogeneous population (Muthén et al., 1999; Nagin, 1999; Nagin, 2005). In our study, final number of trajectories were identified based on the smallest Bayesian information criterion (BIC) (Nylund et al., 2007). Additionally, in the GMM, each trajectory should contain at least 5% of study participants because classes containing smaller portions of the sample have limited practical applicability. In this study, after the final number of trajectories was determined, Chi-square and analysis of variance (ANOVA) tests were applied to examine differences in characteristics of trajectories. Finally, multinomial logistic regressions were used to examine associations between cognitive function trajectories and baseline characteristics.
Materials and methods
- 1. Participant characteristics
- Table 1 shows the characteristics of the 672 study participants. At baseline, the participants were an average of 72.4 years old (SD=5.4), and 60% were female. Most (81.4%) had less than a high school education, and 39.1% were married. The annual household income of most participants (75.5%) was less than 20,000,000 KRW (∼20,000 USD). The average MMSE score was 22.44 (SD=6.17). The duration of diabetes averaged 9.46 years (SD=8.22), and participants had an average of 2.28 (SD=0.97) chronic conditions. Most participants (62.3%) had hypertension, while smaller numbers of participants had heart disease and cerebrovascular disease (12.2% and 6.7%, respectively). The average CES-D score for depressive symptoms was 4.21 (SD=2.94), and over 63.8% of the participants rated their health as poor. Among the participants, 14.6% and 14.3% were current smokers and alcohol users, respectively, and 38.2% exercised regularly. On average, the participants had a BMI score of 23.64 (SD=3.53), a grip strength of 20.67 (SD=7.54), and an ADL score of 0.37 (SD=1.32).
- Baseline characteristics of study participants according to trajectories
- 2. Cognitive function trajectories in older adults with diabetes
- Table 2 shows the model fit for all trajectories and the percentage of participants in each trajectory. Based on the BIC values, five cognitive function trajectories in older adults with diabetes were identified: normal- maintained, normal-declined, mildly impaired-maintained, mildly impaired-declined, and severely impaired-declined (see Fig. 1). The first and largest trajectory was composed of 41.5% of the sample (n=279) and was labeled as the normal-maintained trajectory; this trajectory showed normal cognitive function (MMSE≥24) at baseline and maintained normal cognitive function over 10 years. The second trajectory was composed of 23.8% (n=160) of the sample and was labeled as the normal- declined trajectory; this trajectory showed normal cognitive function at baseline and a steady decline that eventually ended in mildly impaired cognitive function after 10 years. The third trajectory was composed of 17.1% (n=115) of the sample and was labeled as the mildly impaired-maintained trajectory, having mildly impaired cognitive function (MMSE 18∼23) at baseline and maintaining this level of cognitive function over time. The fourth trajectory was composed of 11.2% (n=75) of the sample and was labeled as the mildly impaired-declined trajectory; this trajectory had mildly impaired cognitive function at baseline and showed steady cognitive decline that ended in severe cognitive impairment after 10 years. The fifth and smallest trajectory was composed of 6.4% (n=43) of the sample and was labeled as the severely impaired-declined trajectory, showing severe cognitive impairment (MMSE≤17) at baseline and steep cognitive decline over time.
- Model fit and percentage of study participants in each trajectories
- Baseline participant characteristics are shown according to the five trajectories in Table 1. Significant differences were observed among the five trajectories with respect to baseline age, gender, education, marital status, household income, MMSE score, presence of cerebrovascular disease, depressive symptoms, self-rated health status, regular exercise, BMI, grip strength, and ADL score. No significant differences among the trajectories were observed for baseline duration of diabetes, number of chronic conditions, presence of hypertension or heart disease, smoking, or alcohol use.
- 3. Associations between cognitive function trajectories and baseline characteristics
- Table 3 shows the results of a multinomial logistic regression model that examined how baseline demographic, health status, health behavior, and functional status factors were associated with cognitive function trajectories in older adults with diabetes. In this analysis, we focused on comparing the normal-maintained and normal-declined trajectories as well as the mildly impaired-maintained and mildly impaired-declined trajectories because these comparisons were most clinically relevant. Compared to older adults with the normal-maintained trajectory, those on the normal-declined trajectory were older (OR=1.077, p=.009) and had lower household income (OR=2.000, p=.019) while showing poor self-rated health status (OR=1.983, p=.017). In comparison with the mildly impaired-maintained trajectory, older adults on the mildly impaired- declined trajectory were older (OR=1.130, p=.003) and more likely to be male (OR=5.132, p=.042). No other significant associations with cognitive function trajectories were identified for education, duration of diabetes, presence of hypertension or heart disease, number of chronic conditions, depressive symptoms, smoking, alcohol use, grip strength, or ADL score.
- Results of multinomial regression analysis for cognitive function trajectories
Results
Table 1
Table 2
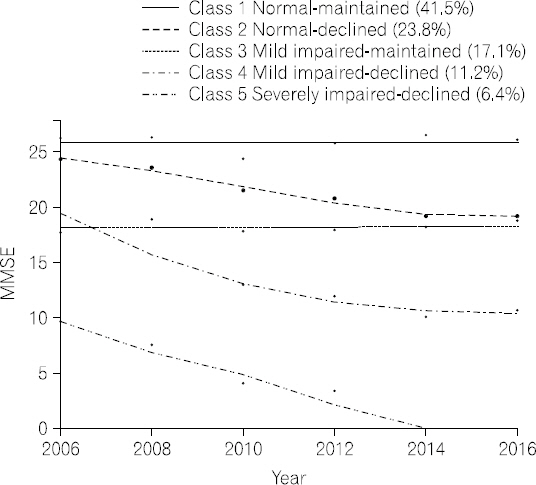
Table 3
| Variables | Normal-maintained vs. Normal-declined | Mildly impaired-maintained vs. Mildly impaired-declined |
|---|---|---|
|
|
|
|
| OR (95% CI) | OR (95% CI) | |
| Age (year) | 1.078 (1.019~1.139)** | 1.130 (1.042~1.226)** |
| Gender (ref. female) | ||
| Male | 0.892 (0.396~2.012) | 5.132 (1.062~24.794)* |
| Education (ref. ≥high school) | ||
| <High school | 1.653 (0.841~3.249) | 0.246 (0.042~1.440) |
| Marital status (ref. married) | 0.830 (0.468~1.474) | 2.127 (0.875~5.172) |
| Not married | ||
| Household Income (ref. ≥20,000,000) | ||
| <20,000,000 (KRW/year) | 2.000 (1.119~3.577)* | 0.578 (0.231~1.449) |
| Duration of diabetes (year) | 1.018 (0.986~1.050) | 0.970 (0.923~1.020) |
| No. of chronic conditions | 0.967 (0.652~1.435) | 0.978 (0.481~1.991) |
| Hypertension (ref. no) | ||
| Yes | 1.115 (0.557~2.234) | 1.849 (0.571~5.988) |
| Heart disease (ref. no) | ||
| Yes | 0.718 (0.296~1.742) | 0.230 (0.038~1.408) |
| Cerebrovascular disease (ref. no) | ||
| Yes | 1.298 (0.406~4.149) | 8.237 (0.594~114.213) |
| Self-rated health status (ref. good) | ||
| Poor | 1.983 (1.129~3.483)* | 0.629 (0.241~1.643) |
| Depressive symptoms (CESD) | 0.967 (0.843~1.019) | 0.978 (0.481~1.991) |
| Current Smoking (ref. not smoking) | ||
| Smoking | 1.732 (0.845~3.552) | 1.068 (0.265~4.305) |
| Alcohol (ref. non-alcohol use) | ||
| Alcohol use | 1.727 (0.874~3.415) | 0.179 (0.031~1.031) |
| Exercise (ref. not exercise) | ||
| Exercise | 0.923 (0.561~1.519) | 0.907 (0.354~2.323) |
| BMI | 0.834 (0.628~1.106) | 1.242 (0.781~1.973) |
| Grip strength | 0.967 (0.920~1.017) | 0.980 (0.895~1.073) |
| ADL | 0.520 (0.239~1.131) | 2.901 (0.758~11.108) |
- Our study aimed to identify and characterize trajectories of cognitive function in community-dwelling older adults with diabetes using data from a Korean population-based, 10-year longitudinal assessment. GMM, a person-oriented approach, was used to identify heterogeneous trajectories of cognitive function in the older adults based on MMSE. The study participants exhibited five distinct cognitive function trajectories: normal- maintained (41.5%), normal-declined (23.8%), mildly impaired-maintained (17.1%), mildly impaired-declined (11.2%), and severely impaired-declined (6.4%). The observed heterogeneity in cognitive function trajectories among older adults with diabetes is consistent with previous study results that identified distinct trajectories in older adults without dementia (Hayden et al., 2011; Hall et al., 2018; Zammit et al., 2018), with MCI (Hanfelt et al., 2011; Xie et al., 2011), and with Alzheimer’s disease (Wilkosz et al., 2010; Leoutsakos et al., 2015).
- In our study, older adults with diabetes having normal cognitive function at baseline showed two distinct trajectories over 10 years. In our sample, 41.5% maintained their normal cognitive function. By way of comparison to studies not focusing on diabetics, in a population-based study, 41% maintained their cognitive function with a slow decline over 10 years based on the MMSE (Terrera et al., 2010). Also, Hayden et al.(2011) found that 65% of older adults free from dementia showed normal cognitive function with a slow decline over 15 years. It is well documented that older adults with diabetes show a greater rate of cognitive decline than those without the disease (Cukierman et al., 2005; Cheng et al., 2012). Although a substantial percentage of our participants—about 42%—maintained their cognitive function over time, about 24% showed a decline. Based on these results, healthcare providers should be aware of the likelihood of cognitive decline among many cognitively intact older adults with diabetes so that they can monitor such individuals for associated symptoms.
- Similarly, participants with mildly impaired cognitive function at baseline were found to belong to two distinct trajectories over time—mildly impaired-maintained (17.1%) and mildly impaired-declined (11.2%). These findings are consistent with those of other longitudinal studies of older adults with MCI, which revealed heterogeneous cognitive function trajectories (Mungas et al., 2010; Xie et al., 2011). Mungas et al.(2010) found that older adults diagnosed with MCI belonged to three distinct cognitive function trajectories, which the researcher described as “some improved, some did not change, and some declined at a rapid rate” (p. 9). Xie et al.(2011) identified five trajectories in a cohort of 187 older adults diagnosed with MCI over 3.5 years. Based on the collective findings of these studies, MCI in older adults with diabetes was not merely a transitional stage in the development of dementia but was rather a heterogeneous phenomenon. Our findings suggest that monitoring the cognitive function of older adults with diabetes and MCI over time may help to identify individuals at heightened risk for dementia. Healthcare providers should recognize that older adults with diabetes and MCI can have different patterns and rates of cognitive change. Thus, healthcare providers should apply a person-oriented approach to help such individuals avoid further cognitive decline and consequent deterioration in diabetes self-management.
- Exploring characteristics of distinct cognitive function trajectories provides useful information for developing strategies that may prevent the progression of cognitive impairment in later life. Our study showed that age, gender, low household income, and self-rated health status all contributed to cognitive function trajectories. As expected, we found that older individuals were more likely to follow declining trajectories, as has been reported in previous studies of the older adult population (Karlamangla et al., 2009; Yaffe et al., 2009; Wilkosz et al., 2010; Xie et al., 2011; Zaninotto et al., 2018). Given the declining cognitive function trajectory with age observed in our study, cognitive function declined more rapidly in males compared with females among older adults with diabetes and MCI at baseline. Our findings of gender differences in cognitive function trajectory among participants with MCI support recent study results indicating that older males had more rapid declines in global cognitive function than females (Zaninotto et al., 2018). However, unlike previous study findings (McCarrey et al., 2016), our study results showed no gender effect on cognitive function trajectory in older adults with diabetes who were cognitively intact at baseline. These differing findings regarding gender effects on cognitive function trajectories may be explained by methodological differences such as use of different study populations and different assessment tools for cognitive function. In our study, the single crude MMSE measure may not have been sensitive enough to detect differences in cognitive decline between females and males.
- Regarding socioeconomic factors, education was not associated with cognitive function trajectories among older adults with diabetes. In prior studies, mixed results were obtained for relationships between education and cognitive function trajectories in older adults: some studies reported significant associations (Terrera et al., 2010; Yu et al., 2012; Verlinden et al., 2016; Zaninotto et al., 2018), while others showed none (Karlamangla et al., 2009; Xie et al., 2011). On the other hand, in our study, household income was found to be associated with cognitive function trajectories. Specifically, cognitively intact older diabetics with low household income were more likely to follow a declining trajectory. This result is consistent with a previous study finding (Zhang et al., 2015) that a significant association existed between socioeconomic status and the rate of cognitive decline in older adults. A possible explanation for Zhang et al.’s (2015) and our results is that older diabetics with low household income are more likely to have poor dietary habits, less healthy lifestyles, and thus poor glucose control that would affect their cognitive function trajectories over time.
- Interestingly, health status variables such as duration of diabetes; number of chronic diseases; comorbidity of hypertension, cardiovascular disease, and cerebrovascular disease; and depressive symptoms were not associated with cognitive function trajectories in this study. However, the initial self-rated health status of older adults with diabetes was significantly associated with cognitive function trajectory among those who were cognitively intact at baseline. Specifically, participants who rated their health as poor at baseline were more likely to be on a declining trajectory. This finding is supported by a 10-year longitudinal study of older adults (Bond et al., 2006) in which self-rated health predicted cognitive impairment as well as mortality and functional impairment. We believe that it is worthwhile for healthcare providers to ask a simple but informative question about self-rated health status in order to identify older adults with diabetes at potentially heightened risk for cognitive decline. Objective health status notwithstanding, healthcare providers should give closer attention to older adults with diabetes who rate their health as poor.
- No significant associations were identified between cognitive function trajectories and health behavior variables (i.e., smoking, alcohol use, exercise, and BMI) in our study. Because health behavior factors can be modified through interventions, more research is needed to identify potential associations between such factors and cognitive function trajectories. Finally, functional status, grip strength, and ADL score at baseline were not associated with cognitive function trajectories.
- One major strength of this study is that our findings are drawn from a nationally representative community- based cohort with 10-year follow-up. Also, our use of GMM that is a person-oriented approach, allowed us to identify heterogeneous trajectories of cognitive function in older adults with diabetes.
- Some potential limitations of our study should be noted. First, in this longitudinal population-based study, the use of a single measure—the MMSE—may not have been adequate to fully detect changes in cognitive function over time. Even though the MMSE has been validated for detection of global cognitive function (Kurlowicz et al., 1999), this measure has been criticized for its ceiling effect and its lack of sensitivity (Tombaugh et al., 1992; Lancu et al., 2006; Mitchell, 2009). Thus, future longitudinal studies involving this population should use a comprehensive cognitive function test battery. Furthermore, clinical and biological risk factors of diabetes (e.g., glucose control, medication types, and history of hypoglycemia), and the use of cognitive enhancement medication, which were not assessed, may have contributed to the predicted trajectories of cognitive function in our study sample. Such factors should be considered in the design of future studies involving older adults with diabetes and their cognitive function trajectories. Finally, the variables were treated as time-invariant. However, changes in some variables such as depressive symptoms, alcohol use, smoking, and BMI may have occurred over the study period, affecting trajectories of cognitive function.
- Given the rapidly aging population and the lifestyle changes seen in the 21st century, the prevalence of diabetes in older adults is likely to continue increasing both in Korea and worldwide. Our findings showed that older adults with diabetes followed five distinct cognitive function trajectories over 10 years. In addition, our findings indicated that age, gender, household income, and self-rated health status are related to increased risk of declining cognitive trajectories in community-dwelling older adults with diabetes. Based on these findings, healthcare providers should be aware that changes in cognitive function among older adults with diabetes are heterogeneous and thus that screenings and interventions should be individualized. Maintaining cognitive function in older adults with diabetes is essential for not only self-management behaviors but also psychological wellbeing and mental health. Thus, our findings have significant implications for the development of tailored interventions for older adults with diabetes to promote their physical and mental health, specifically those at heightened risk for cognitive decline who might neglect essential diabetes self-management activities. Also, the characteristics of declining cognitive function trajectories identified in our study may help healthcare providers to determine the likelihood of cognitive decline in older adults with diabetes and to tailor interventions according to individuals’ risk factors.
Discussion
- The authors declared no conflict of interest.
Conflicts of interest
- American Diabetes Association. 2018;Older Adults:Standards of medical care in diabetes - 2018. Diabetes Care. 41(Suppl.1):S119-S125. doi:10.2337/dc18-S011.PubMed
- Andresen EM, Malmgren JA, Carter WB, et al. 1994;Screening for depression in well older adults:Evaluation of a short form of the CES-D. Am J Prev Med. 10(2):77-84. doi:10.1016/s0749-3797(18)30622-6.ArticlePubMed
- Bergman LR, Trost K. 2006;The person-oriented versus the variable-oriented approach:Are they complementary, opposites, or exploring different worlds? Merrill-Palmer Q. 52(3):601-632. doi:10.1353/mpq.2006.0023.Article
- Bond J, Dickinson HO, Matthews F, et al. 2006;Self-rated health status as a predictor of death, functional and cognitive impairment:a longitudinal cohort study. Eur J Ageing. 3(4):193-206. doi:10.1007/s10433-006-0039-8.ArticlePubMedPMC
- Boo KC, Chang JY. 2006 Korean longitudinal study of ageing:research design for international comparative studies. Surv Res 7:97-122. http://uci.or.kr/G704-001342.2006.7.2.005
- Cheng G, Huang C, Deng H, et al. 2012;Diabetes as a risk factor for dementia and mild cognitive impairment:a meta-analysis of longitudinal studies. Intern Med J. 42(5):484-491. doi:10.1111/j.1445-5994.2012.02758.x.ArticlePubMed
- Cukierman T, Gerstein H, Williamson J. 2005;Cognitive decline and dementia in diabetes—systematic overview of prospective observational studies. Diabetologia. 48(12):2460-2469. doi:10.1007/s00125-005-0023-4.ArticlePubMed
- Hanfelt JJ, Wuu J, Sollinger AB, et al. 2011;An exploration of subgroups of mild cognitive impairment based on cognitive, neuropsychiatric and functional features:Analysis of data from the National Alzheimer's Coordinating Center. Am J Geriatr Psychiatry. 19(11):940-950. doi:10.1097/JGP.0b013e31820ee9d2.ArticlePubMedPMC
- Hayden KM, Reed BR, Manly JJ, et al. 2011;Cognitive decline in the elderly:an analysis of population heterogeneity. Age Ageing. 40(6):684-689. doi:10.1093/ageing/afr101.ArticlePubMedPMC
- Kang YW, Na DL, Hahn S. 1997;A validity study on the Korean Mini-Mental State Examination (K-MMSE) in dementia patients. J Korean Neurol Assoc. 15(2):300-308.
- Karlamangla AS, Miller-Martinez D, Aneshensel CS, et al. 2009;Trajectories of cognitive function in late life in the United States:demographic and socioeconomic predictors. Am J Epidemiol. 170(3):331-342. doi:10.1093/aje/kwp154.ArticlePubMedPMC
- Kurlowicz L, Wallace M. 1999;The mini-mental state examination (MMSE). J Gerontol Nurs. 25(5):8-9. doi:10.3928/0098-9134-19990501-08.Article
- Lancu I, Olmer A. 2006;The minimental state examination--an up-to-date review. Harefuah. 145(9):687-690. .PubMed
- Leoutsakos JM, Forrester SN, Corcoran CD, et al. 2015;Latent classes of course in Alzheimer's disease and predicto:the Cache County Dementia Progression Study. Int J Geriatr Psychiatry. 30(8):824-832. doi:10.1002/gps.4221.ArticlePubMed
- McCarrey AC, An Y, Kitner-Triolo MH, et al. 2016;Sex differences in cognitive trajectories in clinically normal older adults. Psychol Aging. 31(2):166-175. doi:10.1037/pag0000070.ArticlePubMedPMC
- Mitchell AJ. 2009;A meta-analysis of the accuracy of the mini-mental state examination in the detection of dementia and mild cognitive impairment. J Psychiatr Res. 43(4):411-431. doi:10.1016/j.jpsychires.2008.04.014.ArticlePubMed
- Mungas D, Beckett L, Harvey D, et al. 2010;Heterogeneity of cognitive trajectories in diverse older persons. Psychol Aging. 25(3):606doi:10.1037/a0019502.Article
- Muthén B, Shedden K. 1999;Finite mixture modeling with mixture outcomes using the EM algorithm. Biometrics. 55(2):463-469. doi:10.1111/j.0006-341x.1999.00463.x.ArticlePubMed
- Nagin DS. 1999;Analyzing developmental trajectories:a semiparametric, group-based approach. Psychol Methods. 4(2):139-157. doi:10.1037//1082-989x.4.2.139.Article
- Nagin DS. 2005, Group-based modeling of development. Cambridge, MA: Harvard University Press; .
- Noh JH. 2016;The Diabetes Epidemic in Korean. Endocrinol Metab. 31(3):349-353. doi:10. 3803/EnM.2016.31.3.349.ArticlePDF
- Nylund KL, Asparouhov T, Muthén BO. 2007;Deciding on the number of classes in latent class analysis and growth mixture modeling:A Monte Carlo simulation study. Struct Equ Modeling. 14(4):535-569. .Article
- Organisation for Economic Co-operation and Development (2016). OECD Factbook 2015-2016:Economic, Environmental and Social Statistics. Paris: OECD; doi:10.1787/ factbook-2015-en.
- Park JH, Kim HC. 1996;An overview of the mini-mental state examination. Korean J Psychopharmacol. 7(1):13-32.
- Roberts RO, Knopman DS, Przybelski SA, et al. 2014;Association of type 2 diabetes with brain atrophy and cognitive impairment. Neurology. 82(13):1131-1141. doi:10.1212/ WNL.0000000000000269.Article
- Statistics Korea. 2017 2017 cause of death statistics [Internet] Retrieved from: http://kostat.go.kr/portal/korea/kor_nw/3/index.board?bmode=read&bSeq=&aSeq=370711&pageNo=1&rowNum=10&navCount=10&currPg=&sTarget=title&sTxt=
- Statistics Korea. 2018 2018 elderly statistic [Internet] Retrieved from: http://kostat.go.kr/
- Terrera GM, Brayne C, Matthews F. 2010;One size fits all?Why we need more sophisticated analytical methods in the explanation of trajectories of cognition in older age and their potential risk factors. Int Psychogeriatr. 22(2):291-299. doi:10.1017/S1041610209990937.Article
- Tombaugh TN, McIntyre NJ. 1992;The mini-mental state examination:a comprehensive review. J Am Geriatr Soc. 40(9):922-935. doi:10.1111/j.1532-5415.1992.tb01992.x.ArticlePubMed
- Tomlin A, Sinclair A. 2016;The influence of cognition on self-management of type 2 diabetes in older people. Psychol Res Behav Manag. 9:7-20. doi:10.2147/PRBM.S36238.PubMedPMC
- Umegaki H. 2014;Type 2 diabetes as a risk factor for cognitive impairment:current insights. Clin Interv Aging. 9:1011-1019. doi:10.2147/CIA.S48926.ArticlePubMedPMC
- Verlinden VJ, van der Geest JN, de Bruijn RF, et al. 2016;Trajectories of decline in cognition and daily functioning in preclinical dementia. Alzheimer's &Dementia. 12(2):144-153. doi:10.1016/j.jalz.2015.08.001.Article
- Wilkosz PA, Seltman HJ, Devlin B, et al. 2010;Trajectories of cognitive decline in Alzheimer's disease. Int Psychogeriatr. 22(2):281-290. doi:10.1017/S1041610209991001.ArticlePubMed
- Won CW, Yang KY, Rho YG, et al. 2002;The development of Korean activities of daily living (K-ADL) and Korean instrumental activities of daily living (K-IADL) scale. J Korean Geriatr Soc. 6(2):107-120.
- Xie H, Mayo N, Koski L. 2011;Identifying and characterizing trajectories of cognitive change in older persons with mild cognitive impairment. Dement Geriatr Cogn Disord. 31(2):165-172. doi:10.1159/000323568.ArticlePubMed
- Yaffe K, Fiocco AJ, Lindquist K, et al. 2009;Predictors of maintaining cognitive function in older adults The Health ABC Study. Neurology. 72(23):2029-2035. doi:10.1212/WNL. 0b013e3181a92c36.ArticlePubMedPMC
- Yu L, Boyle P, Wilson RS, et al. 2012;A random change point model for cognitive decline in Alzheimer's disease and mild cognitive impairment. Neuroepidemiology. 39(2):73-83. doi:10.1159/000339365.ArticlePubMed
- Zammit AR, Hall CB, Lipton RB, et al. 2018;Identification of Heterogeneous Cognitive Subgroups in Community-Dwelling Older Adults:A Latent Class Analysis of the Einstein Aging Study. J Int Neuropsychol Soc. 24(5):511-523. doi:10.1017/s135561771700128x.ArticlePubMedPMC
- Zaninotto P, Batty GD, Allerhand M, et al. 2018;Cognitive function trajectories and their determinants in older people:8 years of follow-up in the English Longitudinal Study of Ageing. J Epidemiol Community Health, jech-2017-210116. doi:10.1136/jech-2017- 210116.Article
- Zhang M, Gale SD, Erickson LD, et al. 2015;Cognitive function in older adults according to current socioeconomic status. Aging Neuropsychol Cogn. 22(5):534-543. doi:10. 1080/13825585.2014.997663.Article
References
Figure & Data
References
Citations
Citations to this article as recorded by 
- Brain Morphometry and Cognitive Performance in Normal Brain Aging: Age- and Sex-Related Structural and Functional Changes
Yauhen Statsenko, Tetiana Habuza, Darya Smetanina, Gillian Lylian Simiyu, Liaisan Uzianbaeva, Klaus Neidl-Van Gorkom, Nazar Zaki, Inna Charykova, Jamal Al Koteesh, Taleb M. Almansoori, Maroua Belghali, Milos Ljubisavljevic
Frontiers in Aging Neuroscience.2022;[Epub] CrossRef - Predictors of Changes in Cognitive Function in Older Korean Adults: The 2006–2018 Korean Longitudinal Study of Aging
Minjeong Kang, Inhwan Lee, Haeryun Hong, Jeonghyeon Kim, Hyunsik Kang
International Journal of Environmental Research and Public Health.2021; 18(12): 6345. CrossRef
 PubReader
 Cite
Cite