Longitudinal Associations of Perceived Social Inequality and Subjective Socioeconomic Status with Anxiety and Depression in University Students
대학생의 지각된 사회불평등 및 주관적 사회경제적 지위와 불안 및 우울의 종단적 관계
Article information

Abstract
Background
This study examined the longitudinal associations of perceived social inequality (PSI) and subjective socioeconomic status (SSS) with anxiety and depression.
Methods
Data were collected across three time-points over a full semester in 2016 in South Korea. Participants completed an online self-report survey, and data from 247 participants were analyzed.
Results
Older age was associated with lower PSI in treatment of women, and higher SSS was associated with lower overall PSI, particularly regarding the opportunity for advancement and law enforcement. Generalized estimating equation (GEE) analyses indicated that higher PSI was associated with clinical depression (OR=1.56) and lower SSS with clinical anxiety (OR=1.39) and depression (OR=1.38). Female students were also associated with clinical anxiety (OR=5.89) and depression at a marginally significant level (OR=1.93). Higher odds of anxiety were observed in students whose mothers have a high-school education as compared to those whose mothers have a university education or above (OR=2.29).
Conclusions
Current results suggest the need to address the perceived social inequality and subjective socioeconomic status in the management of anxiety and depression in university students.
Trans Abstract
본 연구의 목적은 대학생들이 지각하는 사회적 불평등 및 주관적인 사회경제적 지위와 우울 및 불안의 종단적 관계를 확인하는 것이다. 한국의 대학생들을 대상으로 2016년 한 학기 동안 세 시점에 걸쳐 온라인 설문지를 작성하게 하였고, 총 247명의 데이터가 분석에 포함되었다. GEE 분석 결과, 지각된 사회적 불평등이 높아질수록 우울의 위험율도 높아졌으며(OR=1.56), 주관적 사회경제적 지위가 낮을수록 불안(OR=1.39) 및 우울(OR=1.38)의 위험율이 높아졌다. 해당 결과는 치료 장면에서 대학생들의 불안 및 우울을 다룰 때 이들의 불평등 인식 및 주관적 사회경제적 지위도 고려해야함을 시사한다.
Introduction
Evidence suggests that social inequality, which is a growing global concern, contributes to the risks of depression and anxiety disorders [1]. The association between income inequality and mental disorders has been studied extensively, and its negative impact was corroborated by a prior meta- analysis [2]. To illustrate, a prior meta-analysis estimated a pooled risk ratio of 1.19 in the case of the association between income inequality and depression [3]. Similarly, residing in areas with medium and high income-inequality was associated with a 1.76- and 1.53-times higher risk of depression, respectively, compared to low-inequality areas [4].
However, social inequality encompasses unequal distribution of resources and opportunities in various social domains such as education, employ-ment, and social participation beyond income [5]. For instance, a survey in Chile showed that poor education and poor housing quality, along with a recent income decrease, were associated with an increased prevalence of common mental disorders [6]. Furthermore, several previous studies suggest that women are at higher risk of mental disorders. Female students showed a 1.79-times higher risk of anxiety, compared to male students [7]. A previous meta-analysis estimated a pooled risk ratio of 1.30 in prevalence of depression in female students as compared to their male counterparts, and gender inequality increased depression among female students [8].
The social status of college students affected their college experiences and outcomes as well [9]. For instance, a systematic review showed that a lower socioeconomic status (SES) was related to higher frequencies of depression and anxiety [10]. College students with a low SES were more susceptible to emotional distress, a lower sense of belonging, and negative self-perception [11]. Similarly, an inter-national study involving 17,348 university students from 23 countries indicated that higher depressive symptoms were observed in countries with greater income inequality and a less individualistic culture, and a lower socioeconomic background was asso-ciated with depressive symptoms at individual level [12]. Depression itself constitutes a signi-ficant mental- health issue in university students, and a substantially higher prevalence of depre-ssion was observed in university students than in general populations (i.e., 30.6% versus 9%) [13]. In fact, about 22.1% and 18.1% of college students were diagnosed with or treated for anxiety and depre-ssion, respectively, within a 12-month period [14], indicating that anxiety and depression are major mental-health concerns in higher education. These findings indicate the need to investigate the impact of social inequality on mental-health pro-blems among higher education students.
However, previous studies suggest that one’s perception of social status is more important than objective SES [15]. Subjective socioeconomic status (SSS) refers to an individual’s evaluation of their position in the socioeconomic structure as compared to others. SSS was found to be more consistently and strongly related to psychological functioning than objective SES [16]. A cohort study in London also showed that low SSS was a strong predictor of depression even after accounting for objective SES [17].
Individuals with low SSS are vulnerable to negative emotional experiences because they may feel deprived of fair opportunities and socioeconomic resources that they feel entitled to [18]. Previous studies revealed that this perceived inequality is related to a sense of deprivation [19], inferiority, and insecurity [20], which can lead to depression and anxiety.
As students encounter individuals from various socioeconomic backgrounds in a university, they increasingly tend to make social comparisons [21]. Moreover, a case-study observed that Korean college students no longer think that efforts are converted into rewards through fair competition [22]. Even middle-class students reported feeling incapable of competing with those from a better socioe-conomic background.
In view of this, the present study investigated associations of perceived social inequality (PSI) and SSS with anxiety and depression in university students in Korea in a short-term longitudinal study over the duration of a semester. A few studies have examined this topic; longitudinally designed studies are even fewer. A longitudinal examination would help to understand the tempo-rality and direction of the association of PSI and SSS with anxiety and depression. It is expected that the level of PSI is positively associated with anxiety and depression, while SSS is negatively associated with them. This study also examined whether the level of perception of social inequality differs in relation to sociodemographic character-istics.
Materials and Methods
1. Participants and procedures
Participants from eight universities in the southern region of South Korea completed an online survey across three time-points over a semester: the beginning of the semester (T1); the mid-term (T2); and the end (T3). Out of the 338 participants at T1, 280 (82.8%) and 247 (88.2%) were retained at T2 and T3, respectively (attrition rate: 26.9%). Those who completed the survey only at T1 and/or T2 (i.e., non-completers, n=91) were more likely to be male (c2= 7.11, p<.01) or freshman (c2=9.94, p<.05), and less likely to be sophomore (c2=9.94, p<.05) when compared to the all-time completers (n=247) (Table 1). Clinical anxiety was lower in non-completers than in those who completed the surveys at all time-points (c2= 4.33, p<.05).
Sociodemographic characteristics of completers and non-completers
Data from 247 participants who completed the survey at all time-points were analyzed. The mean age was 20.80 years (SD=1.99) and the majority was female (n=169, 68.4%), with no religion (n=151, 61.4%) (Table 1).
This study was approved by the Institutional Review Board of Pusan National University (PNU IRB/2016_88_HR). All the participants provided written informed consent.
2. Measures
Anxiety was measured using the Korean version of the Generalized Anxiety Disorder-7 (GAD-7) [23]. A prior study validated GAD-7 with a sample of Korean university students and reported that it is a reliable and valid screening tool for anxiety disorders in students [24]. Participants rated seven items on a 4-point Likert scale (0=“not at all,” 3=“nearly every day”). The total scores range from 0 to 21. A score of 10 or above was considered to be clinically moderate to severe level of anxiety in this study. Cronbach’s α of the GAD-7 is .92 [23].
Depression was assessed by the Korean version of the Center for Epidemiological Studies Depression Scale (CES-D) [25]. Participants rated 20 items on a 4-point Likert scale (0=“rarely or none of the time,” 3=“most or all of the time”). The total score ranges from 0 to 60. A prior meta-analysis reported that a cut-off point of 16 yielded high sensitivity (0.87) and moderate specificity (0.70) [26]. In order to capture probable depressive symptoms of the general student population, a score of 16 or above was defined as clinical depression in this study. Cronbach’s α of the Korean CES-D is .91 [25].
PSI was assessed using seven items from the Korean General Social Survey (KGSS). Participants rated a perceived degree of equality regarding seven social domains: opportunities for education, employment, and advancement; law enforcement; treatment of women; income and property; and regional disparity. Each item is rated on a 5-point Likert scale (1=“very equal,” 5=“very unequal”) and higher scores indicate a greater perception of social inequality. Cronbach’s α of these items was .79.
SSS was assessed using the MacArthur Socioeco-nomic Status Ladder subscale [16], and students were asked to select a number between 1 and 10 on the ladder that best represented their socioe-conomic status, with 1 being the worst-off and 10 being the best-off in terms of money, education, and jobs.
The survey also included questions about sociode-mographic characteristics including age, sex, re-ligion, year of study, part-time job, income level, and parents’ education level. Income level is bet-ween 1 and 10 with a higher number indicating a higher income level.
3. Statistical analyses
In order to examine whether PSI differs according to sociodemographic characteristics, analysis of variance and t-tests was conducted. The longitudinal association of PSI and SSS with anxiety and depression was examined using the generalized estimating equation (GEE). GEE is an extension of generalized linear models, which can be applied to non-normal distribution of repeated measurements, and allows researchers to account for the corre-lation within responses when estimating regre-ssion parameters [27]. The clinical level of anxiety and depression was defined by the cut-off scores of GAD-7 (≥10) and CES-D (≥16). Estimated coeffi-cients represent the change in a logit of outcome variable (i.e., anxiety and depression) associated with one-unit score change in PSI and SSS. Working correlation matrix of within-subject dependencies was specified with the exchangeable model based on the assumption that responses within the study sample remain consistent across three time-points. All analyses were conducted using SPSS v. 23.0.
Results
1. PSI according to sociodemographic characteristics
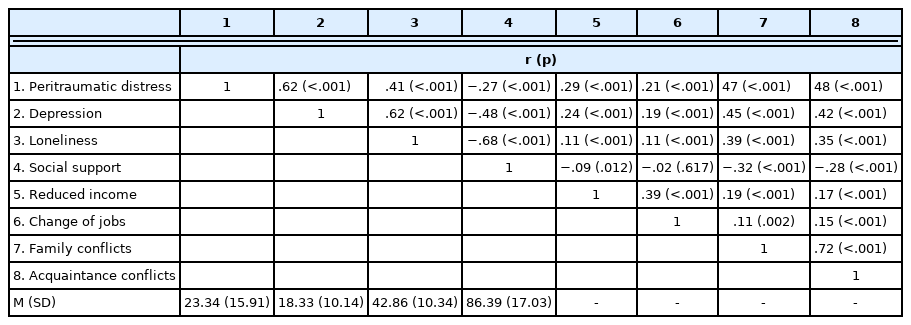
The levels of total PSI and aspects of PSI accor-ding to sociodemographic characteristics are shown in Table 2 ~4. Overall, female students reported higher PSI than male students (t (238)=−4.35, p<.001), particularly regarding the variables of opportunity for employment (t (242)=−4.81, p<.001), advancement (t (232)= −3.94, p<.001), law enforcement (t (242)=−2.48, p= .01), treatment of women (t (240)=−5.73, p<.001), and income and property (t (242)=−2.18, p=.03). Senior students tend to perceive higher levels of inequality with respect to income and property as compared to freshmen at a marginally significant level (p=.06).
Perceived social nequality according to gender, religion, and part-time job
Perceived social inequality according to year of study and income level
Perceived social inequality according to parents’ education level
Age was negatively associated with PSI with respect to treatment of women (r=−.14, p=.03) and older age was associated with lower PSI regarding treatment of women. SSS was negatively correlated with PSI (r=−.16, p=.02), with lower SSS being associated with higher total PSI, parti-cularly regarding the variables of opportunity for advancement (r=−.16, p=.01) and law enforcement (r=−.19, p=.003).
2. Longitudinal association of PSI and SSS with anxiety and depression
GEE results on the associations of PSI with anxiety and depression are shown in Table 5. While higher PSI was associated only with higher risk of clinical depression (OR =1.56, 95% CI: 1.03∼2.39), lower SSS was associated with both clinical anxiety (OR=1.39, 95% CI: 1.06∼1.82) and depre-ssion (OR =1.38, 95% CI: 1.14∼1.68). Female students were also associated with increased risk of clinical anxiety (OR=5.89, 95% CI: 1.46∼23.79) and depre-ssion at a marginally significant level (p=.05, OR= 1.93, 95% CI: 1.01∼3.68). Mother’s education level was associated with anxiety, and higher odds of anxiety was observed in students whose mothers have a high-school education as compared to those whose mothers have a university education or above (OR=2.29, 95% CI: 1.00∼5.27).

Longitudinal associations of PSI and SSS with anxiety and depression
Discussion
This study examined the longitudinal association of PSI and SSS with anxiety and depression in university students over the duration of a semester in South Korea.
First, the examination of PSI levels in relation to sociodemographic characteristics indicated its significant association with age, sex, and SSS. Female students perceived greater social inequality in most social domains as compared to their male counterparts. From this result, it can be inferred that gender equality remains a significant issue as women enjoy limited opportunities in several social domains. The results also indicated that female students were more vulnerable to clinical anxiety and depression, which was consistent with previous findings in university students in Australia that observed higher odds of anxiety (2.26) and depression (1.83) among female students [28]. A previous analysis of collaborative psychiatric epidemiology studies data showed that not only was the prevalence of anxiety disorder higher in women, but its burden (e.g. missing days from work) was also greater than that on men [29]. A previous meta-analysis suggested that gender equity is related to larger gender differences in major depression [30]. PSI and the risks of anxiety and depression were higher in female students in the present study, which, when taken together, warrant particular attention to female students with higher PSI.
Moreover, older age was associated with lower PSI with regard to treatment of women, and lower SSS was associated with greater perception of social inequality overall—particularly regarding the variables of opportunity for advancement and law enforcement. In relation to this, students from low socioeconomic backgrounds had lower levels of educational attainment and educational aspi-rations beyond the bachelor’s degree than students from higher socioeconomic backgrounds [9], and the association between a lower SSS and a higher degree of perceived inequality for advancement in the current study may reflect this reality.
Second, the GEE results indicated that, accounting for sociodemographic variables, PSI was associ-ated with a 1.56-times higher risk of a clinical level depression, but not anxiety. The results corro-borate past related findings on the association between social factors such as social exclusion, race, ethnicity, gender discrimination, and gender identity with higher odds of depression (3.24) in university students [31]. Relatedly, greater income inequality was associated with a heightened risk of clinical depressive symptoms in university students worldwide [12].
While objective income level was not significantly associated with either clinical anxiety or depre-ssion, SSS was negatively associated with both anxiety and depression, the ORs being 1.39 and 1.38, respectively. This complements prior evidence on the association between perception of one’s social status or perceived personal wealth and depression [32]. Similarly, higher odds of anxiety were associated with socioeconomic factors ob-served in a cross-sectional survey in university students in Canada [31]. These results are in line with a prior finding that subjective perceptions of social rank determine the psychological experience of social class [33]. In fact, a prior study suggested an independent and more direct association bet-ween SSS and depressive symptoms in that SSS mediated the association between objective socio-economic status and depressive symptoms [18]. This suggests that the manner in which an individual perceives their social status is a better predictor of mental health than one’s objective socioeconomic status. In relation to this, the present study observed that higher odds of anxiety were related to one’s mother’s level of education in that the risk of anxiety was 2.29- times higher in students whose mothers have a high-school education as compared to those whose mothers have a university education or above. The association between the level of one’s mother’s education and anxiety may reflect the influence of socioeconomic status. In fact, similar associations were previously noted where higher rates of anxiety disorders in young people were related to lower maternal education level along with lower socioeconomic status, and below- average living standards [34].
While the present study did not include variables that may elucidate the mechanisms through which PSI and SSS lead to anxiety and depression, prior evidence proposed a few psychological processes underlying these associations. Sense of relative deprivation is one such process, and it was sug-gested that perception of social inequality may lead to a sense of relative deprivation and unfairness that elicits various emotional reactions [19]. For in-stance, relative deprivation was associated with depression and suicide in university students [35]. Similarly, deprivation was positively associated with non-suicidal self-injury, and depression fully mediated this association for boys and girls as well as anxiety for girls [36]. Moreover, it was suggested that individuals with lower social status— who are more susceptible to unfair treatment—have limited resources. They, therefore, feel greater helplessness, which affects their psychological responses to unfairness [37], and that may cause depression. In relation to this, perceived sense of control can also be a factor explaining the asso-ciations of PSI and SSS with anxiety and de-pression as suggested by the previously noted association between low sense of control and clinical depressive symptoms, along with socio-economic background in university students from 23 countries [12].
Another psychological process is related to social evaluative threat. Those with low social status may experience status-related emotional experiences such as worries, shame, and infe-riority, which can make people anxious [38]. In regard to this, only SSS was associated with both anxiety and depression in the present study and this may be because SSS is directly related to one’s self whereas PSI is a cognitive appraisal of social justice. Additionally, individuals who perceive their social position to be lower than those of others may be more sensitive to issues of social inequality, which may make them more vulnerable to depression and anxiety. The potential mediating effect of PSI in association with SSS and mental-health problems may be examined in future research.
The current results highlight the relevance of considering the perception of socioeconomic status in clinical level anxiety and depression, as well as PSI in depression in university students. While it is important to intervene to reduce social in-equality at the societal level, previous studies suggest the benefit of mental health interventions. A prior study suggested that perceived injustice involves biased cognitive processes such as blame attributions, catastrophic thinking, and revenge motives [39], and thus, cognitive therapy to modify these biases would be helpful. Additionally, mind-fulness intervention for individuals with economic disadvantages was effective in reducing symptoms of stress, anxiety, and depression and cognitive vulnerabilities [40]. Furthermore, studies suggest that social inequality undermines the quality of social relationships and trust in individuals [41]. Therapeutic strategies providing social support and enhancing social relationships may attenuate the detrimental impacts of PSI and SSS on mental-health problems such as depression [42].
Limitations of this study should be noted. First, while it is important to assess the subjective eva-luation of social inequality, no objective measure of social inequality, other than income level, was included. Second, clinical anxiety and depression were defined based on a self-report measure and not based on a clinical diagnosis. Third, we cannot exclude the possibility that pre-existing anxiety and depression influenced PSI and SSS. Hence, the causal interpretation of their associations should be viewed with caution. Fourth, the follow- up period of a single semester was too short to capture significant changes in study variables over time. Last, the relatively small sample size may have affected the statistical power of the analyses.
Nonetheless, the current findings illustrate the effects of PSI and SSS on anxiety and depression in university students, warranting the need to address and manage this “social stress” among university students.
Notes
Conflicts of interest
The authors declared no conflict of interest.
Funding
This study was supported by a two-year research grant from Pusan National University.